Another Word For It Patrick Durusau on Topic Maps and Semantic Diversity

June 18, 2014

Om sweet Om:…

Filed under: Clojure,ClojureScript,React — Patrick Durusau @ 3:52 pm

Om sweet Om: (high-)functional frontend engineering with ClojureScript and React.

From the post:

At Prismatic, we’re firm believers that great products come from a marriage of thoughtful design with rigorous engineering. Effective design requires making educated guesses about what works, building out solutions to test these hypotheses quickly, and iterating based on the results. For example, if you’ve read about our recent feed redesign, then you know that we tested three very different feed layouts in the past year before landing on a design that we and most of our users are quite happy with.

Constant experimentation and iteration presents us with an interesting technical challenge: creating a frontend architecture that allows us to build and test designs quickly, while maintaining acceptable performance for our users.

Specifically, (like most software engineering teams) our primary engineering goals are to maximize productivity and team participation by writing code that:

  • is modular, with minimal coupling between independent components;
  • is simple and readable; and
  • has as few bugs as possible.

In our experience developing web, iOS, and backend applications, we’ve found that much (if not most) coupling, complexity, and bugs are a direct result of managing changes to application state. With ClojureScript and Om (a ClojureScript interface to React), we’ve finally found an architecture that shoulders most of this burden for us on the web. Two months ago, we rewrote our webapp in this architecture, and it’s been a huge boost to our productivity while maintaining snappy runtime performance.

Detailed and very interesting post on a functional approach to UI engineering.

And the promise of more posts to come Om.

One minor quibble with the engineering goal: “has as few bugs as possible.” That isn’t a goal or at least not a realistic one. There is no known measure for approaching the boundary of “as few bugs as possible.” Without a measure, it’s hard to call it a goal.

I first saw this in a tweet by David Nolen.
Finding correlations in complex datasets

Filed under: Interface Research/Design,Visualization — Patrick Durusau @ 3:02 pm

Finding correlations in complex datasets by Andrés Colubri.

From the post:

It is now almost three years since I moved to Boston to start working at Fathom Information Design and the Sabeti Lab at Harvard. As I noted back then, one of the goals of this work was to create new tools for exploring complex datasets -mainly of epidemiological and health data- which could potentially contain up to thousands of different variables. After a process that went from researching visual metaphors suitable to explore these kind of datasets interactively, learning statistical techniques that can be used to quantify general correlations (not necessarily linear or between numerical quantities), and going over several iterations of internal prototypes, we finally released the 1.0 version of a tool called “Mirador” (spanish word for lookout), which attempts to bridge the space between raw data and statistical modeling. Please jump to the Mirador’s homepage to access the software and its user manual, and continue reading below for some more details about the development and design process.

The first step to build a narrative out of data is arguably finding correlations between different magnitudes or variables in the data. For instance, the placement of roads is highly correlated with the anthropogenic and geographical features of a territory. A new, unexpected, intuition-defying, or polemic correlation would probably result in an appealing narrative. Furthermore, a visual representation (of the correlation) that succeeds in its aesthetic language or conceptual clarity is also part of an appealing “data-driven” narrative. Within the scientific domains, these narratives are typically expressed in the form of a model that can be used by the researchers to make predictions. Although fields like Machine Learning and Bayesian Statistics have grown enormously in the past decades and offer techniques that allows the computer to infer predictive models from data, these techniques require careful calibration and overall supervision from the expert users who run these learning and inference algorithms. A key consideration is what variables to include in the inference process, since too few variables might result in a highly-biased model, while too many of them would lead to overfitting and large variance on new data (what is called the bias-variance dilemma.)

Leaving aside model building, an exploratory overview of the correlations in a dataset is also important in situations where one needs to quickly survey association patterns in order to understand ongoing processes, for example, the spread of an infectious disease or the relationship between individual behaviors and health indicators. The early identification of (statistically significant) associations can inform decision making and eventually help to save lives and improve public policy.

With this background in mind, three years ago we embarked in the task of creating a tool that could assist data exploration and model building by providing a visual interface to find and inspect correlations in general datasets, while having a focus on public health and epidemiological data. The thesis work from David Reshef with his tool VisuaLyzer was our starting point. Once we were handed over the initial VisuaLyzer prototype, we carried out a number of development and design iterations at Fathom, which redefined the overall workspace in VisuaLyzer but kept its main visual metaphor for data representation intact. Within this metaphor, the data is presented in “stand-alone” views such scatter plots, histograms, and maps where several “encodings” can be defined at once. An encoding is a mapping between the values of a variable in the dataset and a visual parameter, for example X and Y coordinates, size, color and opacity of the circles representing data instances, etc. This approach of defining multiple encodings in a single “large” data view is similar to what the Gapminder World visualization does.

Mirador self-describes at its homepage:

Mirador is a tool for visual exploration of complex datasets which enables users to infer new hypotheses from the data and discover correlation patterns.

Whether you call them “correlations” or “association patterns” (note the small “a” in associations), in relationships could in fact be modeled by Associations (note the capital “A” in Associations) with a topic map.

An important point for several reasons:

  • In this use case, there may be thousands of variables that contribute to an association pattern.
  • Associations can be discovered in data as opposed to being composed in an authored artifact.
  • Associations give us to the tools to talk about not just the role players identified by data analysis but also potential roles and how they compose an association.

Happy hunting!

GPS: A Graph Processing System

Filed under: Giraph,Graphs,Green-Mari,Pregel — Patrick Durusau @ 2:25 pm

GPS: A Graph Processing System

From the post:

GPS is an open-source system for scalable, fault-tolerant, and easy-to-program execution of algorithms on extremely large graphs. GPS is similar to Google’s proprietary Pregel system, and Apache Giraph.GPS is a distributed system designed to run on a cluster of machines, such as Amazon’s EC2.

In systems such as GPS and Pregel, the input graph (directed, possibly with values on edges) is distributed across machines and vertices send each other messages to perform a computation. Computation is divided into iterations called supersteps. Analogous to the map() and reduce() functions of the MapReduce framework, in each superstep a user-defined function called vertex.compute() is applied to each vertex in parallel. The user expresses the logic of the computation by implementing vertex.compute(). This design is based on Valiant’s Bulk Synchronous Parallel model of computation. A detailed description can be found in the original Pregel paper.

There are five main differences between Pregel and GPS:

  • GPS is open-source.
  • GPS extends Pregel’s API with a master.compute() function, which enables easy and efficient implementation of algorithms that are composed of multiple vertex-centric computations, combined with global computations
  • GPS has an optional dynamic repartitioning scheme, which reassigns vertices to different machines during graph computation to improve performance, based on observing communication patterns.
  • GPS has an optimization called LALP that reduces the network I/O in when running certain algorithms on real-world graphs that have skewed degree distributions.
  • GPS programs can be implemented using a higher-level domain specific language called Green-Marl, and automatically compiled into native GPS code. Green-Marl is a traditional imperative language with several graph-specific language constructs that enable intuitive and simple expression of complicated algorithms.

We have completed an initial version of GPS, which is available to download. We have run GPS on up to 100 Amazon EC2 large instances and on graphs of up to 250 million vertices and 10 billion edges. (emphasis added)

In light of the availability and performance statement, I suppose we can overlook the choice of a potentially confusing acronym. 😉

The Green-Marl compiler can be used to implement algorithms for GPS. Consult the Green-Marl paper before deciding its assumptions about processing will fit your use cases.

The team also wrote: Optimizing Graph Algorithms on Pregel-like Systems, due to appear in VLDB 2014.

I first saw this in a tweet by James Thornton.

Non-Native Written English

Filed under: Corpora,Corpus Linguistics,Linguistics — Patrick Durusau @ 10:50 am

ETS Corpus of Non-Native Written English by Daniel Blanchard, Joel Tetreault, Derrick Higgins, Aoife Cahill, and Martin Chodorow. (Blanchard, Daniel, et al. ETS Corpus of Non-Native Written English LDC2014T06. Web Download. Philadelphia: Linguistic Data Consortium, 2014.)

From the webpage:

ETS Corpus of Non-Native Written English was developed by Educational Testing Service and is comprised of 12,100 English essays written by speakers of 11 non-English native languages as part of an international test of academic English proficiency, TOEFL (Test of English as a Foreign Language). The test includes reading, writing, listening, and speaking sections and is delivered by computer in a secure test center. This release contains 1,100 essays for each of the 11 native languages sampled from eight topics with information about the score level (low/medium/high) for each essay.

The corpus was developed with the specific task of native language identification in mind, but is likely to support tasks and studies in the educational domain, including grammatical error detection and correction and automatic essay scoring, in addition to a broad range of research studies in the fields of natural language processing and corpus linguistics. For the task of native language identification, the following division is recommended: 82% as training data, 9% as development data and 9% as test data, split according to the file IDs accompanying the data set.

A data set for detecting the native language of authors writing in English. Not unlike the post earlier today on LDA, which attempts to detect topics that are (allegedly) behind words in a text.

I mention that because some CS techniques start with the premise that words are indirect representatives of something hidden, while other parts of CS, search for example, presume that words have no depth, only surface. The Google books N-Gram Viewer makes that assumption.

The N-Gram Viewer makes no distinction between any use of these words:

  • awful
  • backlog
  • bad
  • cell
  • fantastic
  • gay
  • rubbers
  • tool

Some have changed meaning recently, others, not quite so recently.

This is a partial list from a common resource: These 12 Everyday Words Used To Have Completely Different Meanings. Imagine if you did the historical research to place words in their particular social context.

It may be necessary for some purposes to presume words are shallow, but always remember that is a presumption and not a truth.

I first saw this in a tweet by Christopher Phipps.

Elsevier open access mathematics

Filed under: Mathematics,Open Access — Patrick Durusau @ 10:20 am

Elsevier open access mathematics

From the webpage:

Elsevier has opened up the back archives of their mathematics journals. All articles older than 4 years are available under a license [1] [2]. This license is compatible with non-commercial redistribution, and so we have collected the PDFs and made them available here.

Each of the links below is for a torrent file; opening this in a suitable client (e.g.Transmission) will download that file. Unzipping that file creates a directory with all the PDFs, along with a copy of the relevant license file.

Although Elsevier opens their archives on a rolling basis, the collections below only contain articles up to 2009. We anticipate adding yearly updates.

You can download a zip file containing all of the torrents below, if you’d like the entire collection. You’ll need about 40GB of free space.

Excellent!

Occurs to me this corpus is suitable for testing indexing and navigation of mathematical literature.

Is your favorite mathematics publisher following Elsevier’s lead?

I first saw this in a tweet by Stephen A. Goss.

Drag-n-Drop Machine Learning?

Filed under: Azure Marketplace,Machine Learning,Microsoft — Patrick Durusau @ 9:34 am

Microsoft to provide drag-and-drop machine learning on Azure by Derrick Harris.

From the post:

Microsoft is stepping up its cloud computing game with a new service called Azure Machine Learning that users visually build and machine learning models, and then publish APIs to insert those models into applications. The service, which will be available for public preview in July, is one of the first of its kind and the latest demonstration of Microsoft’s heavy investment in machine learning.

Azure Machine Learning will include numerous prebuilt model types and packages, including recommendation engines, decision trees, R packages and even deep neural networks (aka deep learning models), explained Joseph Sirosh, corporate vice president at Microsoft. The data that the models train on and analyze can reside in Azure or locally, and users are charged based on the number of API calls to their models and the amount of computing resources consumed running them.

The reason why there are so few data scientists today, Sirosh theorized, is that they need to know so many software tools and so much math and computer science just to experiment and build models. Actually deploying those models into production, especially at scale, opens up a whole new set of engineering challenges. Sirosh said Microsoft hopes Azure Machine Learning will open up advanced machine learning to anyone who understands the R programming language or, really, anyone with a respectable understanding of statistics.

“It’s also very simple. My high school son can build machine learning models and publish APIs,” he said.

Reducing the technical barriers to use machine learning is a great thing. However, if that also results in reducing the understanding of machine learning, its perils and pitfalls, that is also a very bad thing.

One of the strengths of the Weka courses taught by Prof. Ian H. Witten is that students learn that choices are made in machine learning algorithms that aren’t apparent to the casual user. And that data choices can make as much different in outcomes as the algorithms used to process that data.

Use of software with no real understanding of its limitations isn’t new but with Azure Machine Learning any challenge to analysis will be met with the suggestion you “…run the analysis yourself.” Where the speaker does not understand that a replicated a bad result is still a bad result.

Be prepared to challenge data and means of analysis used in drag-n-drop machine learning drive-bys.

Topics and xkcd Comics

Filed under: Latent Dirichlet Allocation (LDA),Statistics,Topic Models (LDA) — Patrick Durusau @ 9:01 am

Finding structure in xkcd comics with Latent Dirichlet Allocation by Carson Sievert.

From the post:

xkcd is self-proclaimed as “a webcomic of romance, sarcasm, math, and language”. There was a recent effort to quantify whether or not these “topics” agree with topics derived from the xkcd text corpus using Latent Dirichlet Allocation (LDA). That analysis makes the all too common folly of choosing an arbitrary number of topics. Maybe xkcd’s tagline does provide a strong prior belief of a small number of topics, but here we take a more objective approach and let the data choose the number of topics. An “optimal” number of topics is found using the Bayesian model selection approach (with uniform prior belief on the number of topics) suggested by Griffiths and Steyvers (2004). After an optimal number is decided, topic interpretations and trends over time are explored.

Great interactive visualization, code for extracting data for xkcd comics, exploring “keywords that are most ‘relevant’ or ‘informative’ to a given topic’s meaning.”

Easy to see this post forming the basis for several sessions on LDA, starting with extracting the data, exploring the choices that influence the results and then visualizing the results of analysis.

Enjoy!

I first saw this in a tweet by Zoltan Varju.

June 17, 2014

Twitter and Refusing Service

Filed under: Tweets — Patrick Durusau @ 6:23 pm

Twitter struggles to remain the free-speech wing of the free-speech party as it suspends terrorist accounts by Mathew Ingram.

Mathew’s headline must be one of those “click-bait” things I keep hearing about.

When followed the link, I was expecting to find that Twitter had suspended the Twitter accounts of Oliver North, Donald Rumsfeld, etc.

No such luck.

What did happen was:

Twitter recently suspended the account belonging to the Islamic State in Iraq and Syria (ISIS) after the group — which claims to represent radical Sunni militants — posted photographs of its activities, including what appeared to be a mass execution in Iraq. The service has also suspended other accounts related to the group for what seem to be similar reasons, including one that live-tweeted the group’s advance into the city of Mosul.

“Terrorism” and “terrorist” depends upon your current side. As I understand recent news, Iran is about to become a United States ally in the Middle East instead of a component of the axis of evil (as per George W. Bush). Amazing the difference that only twelve (12) years make.

A new service motto for Twitter:

Twitter reserves the right to refuse service to anyone at any time.

I know who that motto serves.

Do you?

Foundations of an Alternative Approach to Reification in RDF

Filed under: RDF,Reification,SPARQL — Patrick Durusau @ 4:13 pm

Foundations of an Alternative Approach to Reification in RDF by Olaf Hartig and Bryan Thompson.

Abstract:

This document defines extensions of the RDF data model and of the SPARQL query language that capture an alternative approach to represent statement-level metadata. While this alternative approach is backwards compatible with RDF reification as defined by the RDF standard, the approach aims to address usability and data management shortcomings of RDF reification. One of the great advantages of the proposed approach is that it clarifies a means to (i) understand sparse matrices, the property graph model, hypergraphs, and other data structures with an emphasis on link attributes, (ii) map such data onto RDF, and (iii) query such data using SPARQL. Further, the proposal greatly expands both the freedom that database designers enjoy when creating physical indexing schemes and query plans for graph data annotated with link attributes and the interoperability of those database solutions.

The essence of the approach is to embed triples “in” triples that make statements about the embedded triples.

Works more efficiently than the standard RDF alternative but that’s hardly surprising.

Of course, you remain bound to lexical “sameness” as the identification for the embedded triple but I suppose fixing that would not be backwards compatible with the RDF standard.

I recommend this if you are working with RDF data. No point in it being any more inefficient than absolutely necessary.

PS: Reification is one of those terms that should be stricken from the CS vocabulary.

The question is: Can you make a statement about X? If the answer is no, there is no “reification” of X. Your information system cannot speak of X, which includes assigning any properties to X.

If the answer is yes, then the question is how do you identify X? Olaf and Bryan answer by saying “put a copy of X right here.” That’s one solution.

I first saw this in a tweet by Marin Dimitrov.

Make Category Theory Intuitive!

Filed under: Category Theory,Mathematics — Patrick Durusau @ 10:38 am

Make Category Theory Intuitive! by Jocelyn Ireson-Paine.

From the post:

As I suggested in Chapter 1, the large, highly evolved sensory and motor portions of the brain seem to be the hidden powerhouse behind human thought. By virtue of the great efficiency of these billion-year-old structures, they may embody one million times the effective computational power of the conscious part of our minds. While novice performance can be achieved using conscious thought alone, master-level expertise draws on the enormous hidden resources of these old and specialized areas. Sometimes some of that power can be harnessed by finding and developing a useful mapping between the problem and a sensory intuition.

Although some individuals, through lucky combinations of inheritance and opportunity have developed expert intuitions in certain fields, most of us are amateurs at most things. What we need to improve our performance is explicit external metaphors that can tap our instinctive skills in a direct and repeatable way. Graphs, rules of thumb, physical models illustrating relationships, and other devices are widely and effectively used to enhance comprehension and retention. More recently, interactive pictorial computer interfaces such as those used in the Macintosh have greatly accelerated learning in novices and eased machine use for the experienced. The full sensory involvement possible with magic glasses may enable us to go much further in this direction. Finding the best metaphors will be the work of a generation: for now, we can amuse ourselves by guessing.

Hans Moravec, in Mind Children [Moravec 1988].

This is an essay on why I believe category theory is important to computer science, and should therefore be promoted; and on how we might do so. While writing this, I discovered the passage I’ve quoted above. My ideas are closely related, and since there’s nothing more pleasing than being supported by such an authority, that’s why I’ve quoted it here.

Category theory has been around since the 1940s, and was invented to unify different treatments of homology theory, a branch of algebraic topology [Marquis 2004; Natural transformation]. It’s from there that many examples used in teaching category theory to mathematicians come. Which is a shame, because algebraic topology is advanced: probably post-grad level. Examples based on it are not much use below that level, and not much use to non-mathematicians. The same applies to a lot of the other maths to which category theory has been applied.

An interesting essay with many suggestions for teaching category theory. Follow this essay with a visit to Jocelyn’s homepage and the resources on category theory cited there. Caution: You will find a number of other very interesting things on the homepage. You have been warned. 😉

Spreadsheets too! What is it with people studying something that is nearly universal in business and science? Is that why vendors make money? Pandering to the needs of the masses? Is that a clue on being a successful startup? Appeal to the masses and not the righteous?

If you try the Category Theory Demonstrations, be aware the page refreshes with a statement: “Your results are here” near the top of the page. Follow that link for your results.

In a thread on those demonstrations, Jocelyn laments the lack of interest among those who already understand category theory in finding more intuitive ways of explaining it. I have no explanation to offer but can attest to the same lack of interest among lawyers, academics in general, etc. in making their knowledge more “intuitive.”

So how do you successfully promote projects designed to make institutions or disciplines more “transparent?” A general public interest in “transparency” doesn’t translate easily into donations or institutional support. Suggestions?

June 16, 2014

Erlang/OTP [New Homepage]

Filed under: Clustering (servers),Erlang — Patrick Durusau @ 7:03 pm

Erlang/OTP [New Homepage]

I saw a tweet advising that the Erlang/OTP homepage had been re-written.

This shot from the Wayback Machine, dated October 11, 2011, Erlang/OTP homepage 2011, is how I remember the old homepage.

Today, the page seems a bit deep to me but includes details like the top three reasons to use Erlang/OTP for a cluster system (C/S):

  • Cost cheaper to use an open source C/S than write or rent one
  • Speed To Market quicker to use an C/S than write one
  • Availability and Reliability Erlang/OTP systems have been measured at 99.9999999% uptime (31ms a year downtime) (emphasis added)

That would be a good question to ask at the next big data conference: What is the measured reliability of system X?

You complete me

Filed under: ElasticSearch,Search Engines — Patrick Durusau @ 6:50 pm

You complete me by Alexander Reelsen.

From the post:

Effective search is not just about returning relevant results when a user types in a search phrase, it’s also about helping your user to choose the best search phrases. Elasticsearch already has did-you-mean functionality which can correct the user’s spelling after they have searched. Now, we are adding the completion suggester which can make suggestions while-you-type. Giving the user the right search phrase before they have issued their first search makes for happier users and reduced load on your servers.

In the context of search you can suggest search phrases. (Alexander’s post is a bit dated so see: the Elasticsearch documentation as well.)

How much further can you go with suggestions? Search syntax?

Beware the Confident Counterfactual

Filed under: Politics — Patrick Durusau @ 6:26 pm

Beware the Confident Counterfactual by Jay Ulfelder.

From the post:

Did you anticipate the Syrian uprising that began in 2011? What about the Tunisian, Egyptian, and Libyan uprisings that preceded and arguably shaped it? Did you anticipate that Assad would survive the first three years of civil war there, or that Iraq’s civil war would wax again as intensely as it has in the past few days?

All of these events or outcomes were difficult forecasting problems before they occurred, and many observers have been frank about their own surprise at many of them. At the same time, many of those same observers speak with confidence about the causes of those events. The invasion of Iraq in 2003 surely is or is not the cause of the now-raging civil war in that country. The absence of direct US or NATO military intervention in Syria is or is not to blame for continuation of that country’s civil war and the mass atrocities it has brought—and, by extension, the resurgence of civil war in Iraq.

But here’s the thing: strong causal claims require some confidence about how history would have unfolded in the absence of the cause of interest, and those counterfactual histories are no easier to get right than observed history was to anticipate.

Like all of the most interesting questions, what causality means and how we might demonstrate it will forever be matters for debate—see here on Daniel Little’s blog for an overview of that debate’s recent state—but most conceptions revolve around some idea of necessity. When we say X caused Y, we usually mean that had X not occurred, Y wouldn’t have happened, either. Subtler or less stringent versions might center on salience instead of necessity and insert a “probably” into the final phrase of the previous sentence, but the core idea is the same.
….

A post to keep in mind when the “…I told you so…” claims start about recent prisoner releases by the United States.

Annotating the news

Filed under: Annotation,Authoring Topic Maps,News,Reporting — Patrick Durusau @ 4:56 pm

Annotating the news: Can online annotation tools help us become better news consumers? by Jihii Jolly.

From the post:

Last fall, Thomas Rochowicz, an economics teacher at Washington Heights Expeditionary Learning School in New York, asked his seniors to research news stories about steroids, drone strikes, and healthcare that could be applied to their class reading of Michael Sandel’s Justice. The students were to annotate their articles using Ponder, a tool that teachers can use to track what their students read and how they react to it. Ponder works as a browser extension that tracks how long a reader spends on a page, and it allows them to make inline annotations, which include highlights, text, and reaction buttons. These allow students to mark points in the article that relate to what they are learning in class—in this case, about economic theories. Responses are aggregated and sent back to the class feed, which the teacher controls.

Interesting piece on the use of annotation software with news stories.

I don’t know how configurable Ponder is in terms of annotation and reporting but being able to annotate web and pdf documents would be a long step towards lay authoring of topic maps.

For example, the “type” of a subject could be selected from a pre-composed list and associations created to map this occurrence of the subject in a particular document, by a particular author, etc. I can’t think of any practical reason to bother the average author with such details. Can you?

Certainly an expert author should have the ability to be less productive and more precise than the average reader but then we are talking about news stories. 😉 How precise does it need to be?

The post also mentions News Genius, which was pointed out to me by Sam Hunting some time ago. Probably better known for its annotation of rap music at rap genius. The only downside I see to Rap/News Genius is that the text to be annotated is loaded onto the site.

That is a disadvantage because if I wanted to create a topic map from annotations of archive files from the New York Times, that would not be possible. Remote annotation and then re-display of those annotations when a text is viewed (by an authorized user) is the sin qua non of topic maps for data resources.

Digital Mapping + Geospatial Humanities

Filed under: Geographic Data,GIS,Humanities,Mapping,Maps — Patrick Durusau @ 3:59 pm

Digital Mapping + Geospatial Humanities by Fred Gibbs.

From the course description:

We are in the midst of a major paradigm shift in human consciousness and society caused by our ubiquitous connectedness via the internet and smartphones. These globalizing forces have telescoped space and time to an unprecedented degree, while paradoxically heightening the importance of local places.

The course explores the technologies, tools, and workflows that can help collect, connect, and present online interpretations of the spaces around us. Throughout the week, we’ll discuss the theoretical and practical challenges of deep mapping (producing rich, interactive maps with multiple layers of information). Woven into our discussions will be numerous technical tutorials that will allow us to tell map-based stories about Albuquerque’s fascinating past.


This course combines cartography, geography, GIS, history, sociology, ethnography, computer science, and graphic design. While we cover some of the basics of each of these, the course eschews developing deep expertise in any of these in favor of exploring their intersections with each other, and formulating critical questions that span these normally disconnected disciplines. By the end, you should be able to think more critically about maps, place, and our online experiences with them.


We’ll move from creating simple maps with Google Maps/Earth to creating your own custom, interactive online maps with various open source tools like QGIS, Open Street Map, and D3 that leverage the power of open data from local and national repositories to provide new perspectives on the built environment. We’ll also use various mobile apps for data collection, online exhibit software, (physical and digital) historical archives at the Center for Southwest Research. Along the way we’ll cover the various data formats (KML, XML, GeoJSON, TopoJSON) used by different tools and how to move between them, allowing you to craft the most efficient workflow for your mapping purposes.

Course readings that aren’t freely availabe online (and even some that are) can be accessed via the course Zotero Library. You’ll need to be invited to join the group since we use it to distribute course readings. If you are not familiar with Zotero, here are some instructions.

All of that in a week! This week as a matter of fact.

One of the things I miss about academia are the occasions when you can concentrate on one subject to the exclusion of all else. Of course, being unmarried at that age, unemployed, etc. may have contributed to the ability to focus. 😉

Just sampled some of the readings and this appears to be a really rocking course!

JSON-LD for software discovery…

Filed under: JSON,Linked Data,RDF,Semantic Web — Patrick Durusau @ 3:43 pm

JSON-LD for software discovery, reuse and credit by Afron Smith.

From the post:

JSON-LD is a way of describing data with additional context (or semantics if you like) so that for a JSON record like this:

{ "name" : "Arfon" }

when there’s an entity called name you know that it means the name of a person and not a place.

If you haven’t heard of JSON-LD then there are some great resources here and an excellent short screencast on YouTube here.

One of the reasons JSON-LD is particularly exciting is that it’s a lightweight way of organising JSON-formatted data and giving semantic meaning without having to care about things like RDF data models, XML and the (note the capitals) Semantic Web. Being much more succinct than XML and JavaScript native, JSON has over the past few years become the way to expose data through a web-based API. JSON-LD offers a way for API provides (and consumers) to share data more easily with little or no ambiguity about what the data they’re describing.

The YouTube video “What is JSON-LD?” by Manu Sporny makes an interesting point about the “ambiguity problem,” that is do you mean by “name” what I mean by “name” as a property?

At about time mark 5:36, Manu addresses the “ambiguity problem.”

The resolution of the ambiguity is to use a hyperlink as an identifier, the implication being that if we use the same identifier, we are talking about the same thing. (That isn’t true in real life, cf. the many meanings of owl:sameAS, but for simplicity sake, let’s leave that to one side.)

OK, what is the difference in both of us using the string “name” and both of us using the string “http://ex.com/name”? Both of them are opaque strings that either match or don’t. This just kicks the semantic can a little bit further down the road.

Let me use a better example from json-ld.org:

{
"@context": "http://json-ld.org/contexts/person.jsonld",
"@id": "http://dbpedia.org/resource/John_Lennon",
"name": "John Lennon",
"born": "1940-10-09",
"spouse": "http://dbpedia.org/resource/Cynthia_Lennon"
}

If you follow http://json-ld.org/contexts/person.jsonld you will obtain a 2.4k JSON-LD file that contains (in part):

“Person”: “http://xmlns.com/foaf/0.1/Person

Following that link results in a webpage that reads in part:

The Person class represents people. Something is a Person if it is a person. We don’t nitpic about whether they’re alive, dead, real, or imaginary. The Person class is a sub-class of the Agent class, since all people are considered ‘agents’ in FOAF.

and it is said to be:

Disjoint With: Project Organization

Ambiguity jumps back to the fore with: Something is a Person if it is a person.

What is that solipsism? Tautology?

There is no opportunity to say what properties are necessary to qualify as a “person” in the sense defined FOAF.

You may think that is nit-picking but without the ability to designate properties required to be a “person,” it isn’t possible to talk about U.S.C Title 42: 1983 civil rights actions where municipalities are held to be “persons” within the meaning of this law. That’s just one example. There are numerous variations on “person” for legal purposes.

You could argue that JSON-LD is for superficial or bubble-gum semantics but it is too useful a syntax for that fate.

Rather I would like to see JSON-LD to make ambiguity “manageable” by its users. True, you could define a “you know what I mean” document like FOAF, if that suits your purposes. On the other hand, you should be able to define required key/value pairs for any subject and for any key or value to extend an existing definition.

How far you need to go is on a case by case basis. For apps that display “AI” by tracking you and pushing more ads your way, FOAF may well be sufficient. For those of us with non-advertising driven interests, other diversions may await.

June 15, 2014

Frequentism and Bayesianism: A Practical Introduction

Filed under: Bayesian Data Analysis,Statistics — Patrick Durusau @ 7:14 pm

Frequentism and Bayesianism: A Practical Introduction by Jake Vanderplas.

From the post:

One of the first things a scientist hears about statistics is that there is are two different approaches: frequentism and Bayesianism. Despite their importance, many scientific researchers never have opportunity to learn the distinctions between them and the different practical approaches that result. The purpose of this post is to synthesize the philosophical and pragmatic aspects of the frequentist and Bayesian approaches, so that scientists like myself might be better prepared to understand the types of data analysis people do.

I’ll start by addressing the philosophical distinctions between the views, and from there move to discussion of how these ideas are applied in practice, with some Python code snippets demonstrating the difference between the approaches.

This is the first of four posts that include Python code to demonstrate the impact of your starting position.

The other posts are:

Very well written and highly entertaining!

Jake leaves out another approach to statistics: Lying.

Lying avoids the need for a philosophical position or to have data for processing with Python or any other programming language. Even calculations can be lied about.

Most commonly found political campaigns, legislative hearings and the like. How you would characterize any particular political lie is left as an exercise for the reader. 😉

Analyzing 1.2 Million Network Packets…

Filed under: ElasticSearch,Hadoop,HBase,Hive,Hortonworks,Kafka,Storm — Patrick Durusau @ 4:19 pm

Analyzing 1.2 Million Network Packets per Second in Real Time by James Sirota and Sheetal Dolas.

Slides giving an overview of OpenSOC (Open Security Operations Center).

I mention this in case you are not the NSA and simply streaming the backbone of the Internet to storage for later analysis. Some business cases require real time results.

The project is also a good demonstration of building a high throughput system using only open source software.

Not to mention a useful collaboration between Cisco and Hortonworks.

BTW, take a look at slide 18. I would say they are adding information to the representative of a subject, wouldn’t you? While on the surface this looks easy, merging that data with other data, say held by local law enforcement, might not be so easy.

For example, depending on where you are intercepting traffic, you will be told I am about thirty (30) miles from my present physical location or some other answer. 😉 Now, if someone had annotated an earlier packet with that information and it was accessible to you, well, your targeting of my location could be a good deal more precise.

And there is the question of using data annotated by different sources who may have been attacked by the same person or group.

Even at 1.2 million packets per second there is still a role for subject identity and merging.

What You Thought The Supreme Court…

Filed under: Law,Law - Sources,Legal Informatics,Subject Identity — Patrick Durusau @ 3:45 pm

Clever piece of code exposes hidden changes to Supreme Court opinions by Jeff John Roberts.

From the post:

Supreme Court opinions are the law of the land, and so it’s a problem when the Justices change the words of the decisions without telling anyone. This happens on a regular basis, but fortunately a lawyer in Washington appears to have just found a solution.

The issue, as Adam Liptak explained in the New York Times, is that original statements by the Justices about everything from EPA policy to American Jewish communities, are disappearing from decisions — and being replaced by new language that says something entirely different. As you can imagine, this is a problem for lawyers, scholars, journalists and everyone else who relies on Supreme Court opinions.

Until now, the only way to detect when a decision has been altered is a pain-staking comparison of earlier and later copies — provided, of course, that someone knew a decision had been changed in the first place. Thanks to a simple Twitter tool, the process may become much easier.

See Jeff’s post for more details, including a twitter account to follow the discovery of changes in opinions in the opinions of the Supreme Court of the United States.

In a nutshell, the court issues “slip” opinions in cases they decide and then later, sometimes years later, they provide a small group of publishers of their opinions with changes to be made to those opinions.

Which means the opinion you read as a “slip” opinion or in an advance sheet (paper back issue that is followed by a hard copy volume combining one or more advance sheets), may not be the opinion of record down the road.

Two questions occur to me immediately:

  1. We can distinguish the “slip” opinion version of an opinion from the “final” published opinion, but how do we distinguish a “final” published decision from a later “more final” published decision? Given the stakes at hand in proceedings before the Supreme Court, certainty about the prior opinions of the Court is very important.
  2. While the Supreme Court always gets most of the attention, it occurs to me that the same process of silent correction has been going on for other courts with published opinions, such as the United States Courts of Appeal and the United States District Courts. Perhaps for the last century or more.

    Which makes it only a small step to ask about state supreme courts and their courts of appeal. What is their record on silent correction of opinions?

There are mechanical difficulties the older records become because the “slip” opinions may be lost to history but in terms of volume, that would certainly be a “big data” project for legal informatics. To discover and document the behavior of courts over time with regard to silent correction of opinions.

What you thought the Supreme Court said may not be what our current record reflects. Who wins? What you heard or what a silently corrected record reports?

Read Lisp, Tweak Emacs

Filed under: Editor,Lisp — Patrick Durusau @ 3:20 pm

Read Lisp, Tweak Emacs by Sacha Chua.

Sacha is writing a series of posts on reading Lisp and tweaking Emacs.

Thus far:

And she is writing content for an email course on Lisp and Emacs, that can be found at:

http://emacslife.com/how-to-read-emacs-lisp.html

Not that Emacs will ever be a mainstream editor for topic maps but it could be useful to experiment with features for a topic map authoring/editing environment.

How to translate useful features into less capable editors will vary from editor to editor. 😉

Applicative Parser [Clojure]

Filed under: Clojure,Functional Programming,Haskell,Parsers — Patrick Durusau @ 2:35 pm

Applicative Parser by Jim Duey.

In the next couple of posts, I’m going to show how to build a parser library based on the Free Applicative Functor and what you can do with it. To follow along, clone (or update) this repo. Then ‘lein repl’ and you should be able to copy the code to see what it does.

This post runs long (again). The code is really not that long and it’s mostly very small functions. But the amount of details hidden by the abstractions takes a lot of prose to explain. Which is actually one of the very real benefits of using these abstractions. They let you implement an enormous amount of functionality in very few lines of code with fewer bugs.

If you want to see what the point of all this prose is, skip to the “Other Interpretations” section at the bottom and then come back to see how it was done.

Warning: Heavy sledding!

You may want to start with: The basics of applicative functors, put to practical work [Haskell] by Bryan O’Sullivan, which parses “[an] application/x-www-form-urlencoded string.”

On the other hand, if you want the full explanation, consider Applicative Programming with Effects by Conor McBride and Ross Paterson. in Journal of Functional Programming 18:1 (2008), pages 1-13.

Abstract:

In this paper, we introduce Applicative functors–an abstract characterisation of an applicative style of effectful programming, weaker than Monads and hence more widespread. Indeed, it is the ubiquity of this programming pattern that drew us to the abstraction. We retrace our steps in this paper, introducing the applicative pattern by diverse examples, then abstracting it to define the Applicative type class and introducing a bracket notation which interprets the normal application syntax in the idiom of an Applicative functor. Further, we develop the properties of applicative functors and the generic operations they support. We close by identifying the categorical structure of applicative functors and examining their relationship both with Monads and with Arrows.

The page for McBride and Patterson’s paper points to later resources as well.

Enjoy!

June 14, 2014

Access To Information Is Power

Filed under: Information Theory,NSA — Patrick Durusau @ 4:52 pm

No Place to Hide Freed

From the post:

After reading No Place to Hide on day of release and whipping out a review, now these second thoughts:

We screen shot the Kindle edition, plugged the double-paged images into Word, and printed five PDFs of the Introduction, Chapter 1 through 5, and Epilogue. Then put the 7Z package online at Cryptome.

This was done to make more of Edward Snowden’s NSA material available to readers than will be done by the various books about it — NPTH among a half-dozen — hundreds of news and opinion articles, TV appearances and awards ceremonies by Snowden, Greenwald, Poitras, McAskin, Gellman, Alexander, Clapper, national leaders and gaggles of journalist hobos of the Snowden Intercept of NSA runaway metadata traffic.

The copying and unlimited distribution of No Place to Hide is to compensate in a small way for the failure to release 95% of the Snowden material to the public.

After Snowden dumped the full material on Greenwald, Poitras and Gellman, about 97% of it has been withheld. This book provides a minuscule amount, 106 images, of the 1500 pages released so far out of between 59,000 and 1.7 million allegedly taken by Snowden.

Interesting that the post concludes:

Read No Place to Hide and wonder why it does not foster accelerated, full release of the Snowden material, to instead for secretkeepers of all stripes profit from limited releases and inadequate, under-informed public debate.

I would think the answer to the concluding question is self-evident.

The NSA kept the programs and documents about the programs secret in order to avoid public debate and the potential, however unlikely, of being held responsible for violation of various laws. There is no exception in the United States Constitution that reads: “the executive branch is freed from the restrictions of this constitution when at its option, it decides that freedom to be necessary.”

I have read the United States Constitution rather carefully and at least in my reading, there is no such language.

The answer for Glenn Greenwald is even easier. What should be the basis for a public debate over privacy and what government measures, if any, are appropriate when defending itself against a smallish band of malcontents into a cash cow for Glenn Greenwald. Because Greenwald has copies of the documents stolen by Snowden, he can expect to sell news stories, to be courted and feted by news organizations, etc., for the rest of his life.

Neither the NSA nor Greenwald are interested in a full distribution of all the documents taken by Snowden. Nor are they interested in a fully informed public debate.

Their differences on the release of some documents is a question of whose interest in being served rather than a question of public interest.

Leaking documents to the press is a good way to make someone’s career. Not a good way to get secrets out for public debate.

Leak to the press if you have to but also post full copies to as many public repositories as possible.

Access to information is power. The NSA and Greenwald have it and they are not going to share it with you, at least voluntarily.

Capturing Illogical Relationships

Filed under: Government,Graphics,Visualization — Patrick Durusau @ 12:48 pm

Syrian Conflict

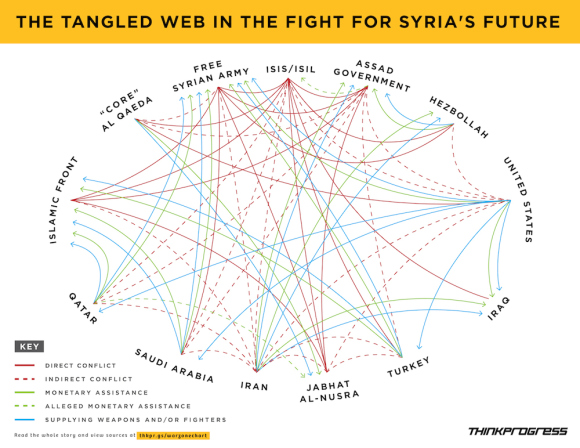
This graphic from ISIS Against The World is described as:

More Iraqi towns fell to “worse-than-al-Qaeda” overnight. The above chart from Hayes Brown and Adam Peck illustrates how ISIS is really at war with everybody:

A great illustration of the routine complexity of relationships between governments and other parties. (Is NGO the correct term for ISIS and al-Qaeda? Neither one is a government, yet.)

And it illustrates the lack of logic, first order or otherwise, in important events and relationships.

For example, the “indirect conflict” line between the United States and Iran may remain but in the near term, it will be supplemented with a lines showing monetary and weapons assistance, so long as Iran opposes ISIS. And other lines could change and/or be supplemented depending on the shifting fortunes of war and policy.

While this great graphic will get your attention, it doesn’t help navigate the vast stores of information on any of these parties or on relationships between individuals working for these parties.

For example, there were discussions with Qatar recently that resulted in the release of a prisoner held by al-Qaeda. Who were those discussions with and what could be done to enlist al-Qaeda to assist in taking down the leadership of ISIS?

Such details would not be in a public topic map, but as it is, I rather doubt the actual decisions makers know if that information is available or not.

The point being that mission critical information is no doubt siloed in Defense, State, NSA, CIA, and various other groups within the United States, if we are talking about a topic map from a U.S. perspective.

Not that we need another data dump facility like that maintained by Edward Snowden, but a topic map could point to holder of relevant information without disclosing its full content. Enabling someone with a “need to know” to be able to approach the holder with a request for the details.

Something to think about as the situation in the “Middle East” becomes more complicated.

PS: The graphic doesn’t encompass the “Middle East” as usually defined. Wikipedia in Middle East gives the following list of countries:

Can you think of a reason to use a smaller definition of “Middle East?”

June 13, 2014

Al Jazeera

Filed under: News,Reporting — Patrick Durusau @ 6:58 pm

Al Jazeera just soft-launched its AJ+ online video network by Janko Roettgers.

From the post:

Qatar-based Al Jazeera soft-launched its AJ+ online video network Friday with a new YouTube channel as well as a dedicated Facebook page and Twitter account. Al Jazeera also announced AJ+ with a press release that described the network as “current affairs experience for mobiles and social streams,” and promised a formal launch later this year.

Cool!

Should be useful for topic maps on current events that try to not be US-centric.

Master Metaphor List

Filed under: Linguistics,Metaphors — Patrick Durusau @ 6:39 pm

Master Metaphor List (2nd edition) by George Lakoff, Jane Espenson, and Alan Schwartz.

From the cover page:

This is the second attempt to compile in one place the results of metaphor research since the publication of Reddys‘ ‘The Conduit Metaphor’ and Lakoff and Johnson’s Metaphors We Live By. This list is a compilation taken from published books and papers, student papers at Berkeley and else where, and research seminars. This represents perhaps 20 percent (a very rough estimate) of the material we have that needs to be compiled.

‘Compiling’ includes reanalyzing the metaphors and fitting them into something resembling a uniform format. The present list is anything but a finished product. This catalog is not intended to be definitive in any way. It is simply what happens to have been catalogued by volunteer labor by the date of distribution. We are making it available to students and colleagues in the hope that they can improve upon it and use it as a place to begin further research.

We expect to have subsequent drafts appearing at regular intervals. Readers are encouraged to submit ideas for additions and revisions.

Because of the size and complexity of the list, we have included a number of features to make using it easier. The Table of Contents at the beginning of the catalog lists the files in each of the four sections in the order in which they appear. At the beginning of each section is a brief description of the metaphors contained within. Finally, an alphabetized index of metaphor names has been provided.

What I haven’t seen at George Lakoff’s website are “subsequent drafts” of this document. You?

Nowadays I would expect the bibliography entries to be pointers to specific documents.

It was in looking for later resources that I discovered:

The EuroWordNet project was completed in the summer of 1999. The design of the database, the defined relations, the top-ontology and the Inter-Lingual-Index are now frozen. EuroWordNet)

I wasn’t aware that new words and metaphors had stopped entering Dutch, Italian, Spanish, German, French, Czech and Estonian in 1999. You see, it is true, you can learn something new everyday!

Of course, in this case, what I learned is false. Dutch, Italian, Spanish, German, French, Czech and Estonian continue to enrich themselves and create new metaphors.

Unlike first order logic (FOL) in the views of some.

Maybe that is why Dutch, Italian, Spanish, German, French, Czech and Estonian are all more popular than FOL by varying orders of magnitude.

I first saw this in a tweet by Francis Storr.

E. W. Dijkstra Archive

Filed under: Computer Science — Patrick Durusau @ 3:34 pm

E. W. Dijkstra Archive the manuscripts of Edsger W. Dijkstra 1930-2002.

From the webpage:

Edsger Wybe Dijkstra was one of the most influential members of computing science’s founding generation. Among the domains in which his scientific contributions are fundamental are

  • algorithm design
  • programming languages
  • program design
  • operating systems
  • distributed processing
  • formal specification and verification
  • design of mathematical arguments

In addition, Dijkstra was intensely interested in teaching, and in the relationships between academic computing science and the software industry.

During his forty-plus years as a computing scientist, which included positions in both academia and industry, Dijkstra’s contributions brought him many prizes and awards, including computing science’s highest honor, the ACM Turing Award.

The Manuscripts

Like most of us, Dijkstra always believed it a scientist’s duty to maintain a lively correspondence with his scientific colleagues. To a greater extent than most of us, he put that conviction into practice. For over four decades, he mailed copies of his consecutively numbered technical notes, trip reports, insightful observations, and pungent commentaries, known collectively as “EWDs”, to several dozen recipients in academia and industry. Thanks to the ubiquity of the photocopier and the wide interest in Dijkstra’s writings, the informal circulation of many of the EWDs eventually reached into the thousands.

Although most of Dijkstra’s publications began life as EWD manuscripts, the great majority of his manuscripts remain unpublished. They have been inaccessible to many potential readers, and those who have received copies have been unable to cite them in their own work. To alleviate both of these problems, the department has collected over a thousand of the manuscripts in this permanent web site, in the form of PDF bitmap documents (to read them, you’ll need a copy of Acrobat Reader). We hope you will find it convenient, useful, inspiring, and enjoyable.

What an awesome collection of materials!

In addition to images of the manuscripts, there are numerous links to other resources that will be of interest.

Ignore the “…most recent change was posted on 5 April 2008” notice on the homepage. If you look at changes to the site, the most recent updates were 20 June 2013, so it is still an active project.

I first saw this in a tweet by Computer Science.

SecureGraph Slides!

Filed under: Accumulo,Graphs,SecureGraph — Patrick Durusau @ 3:10 pm

Open Source Graph Analysis and Visualization by Jeff Kunkle.

From the description:

Lumify is a relatively new open source platform for big data analysis and visualization, designed to help organizations derive actionable insights from the large volumes of diverse data flowing through their enterprise. Utilizing popular big data tools like Hadoop, Accumulo, and Storm, it ingests and integrates many kinds of data, from unstructured text documents and structured datasets, to images and video. Several open source analytic tools (including Tika, OpenNLP, CLAVIN, OpenCV, and ElasticSearch) are used to enrich the data, increase its discoverability, and automatically uncover hidden connections. All information is stored in a secure graph database implemented on top of Accumulo to support cell-level security of all data and metadata elements. A modern, browser-based user interface enables analysts to explore and manipulate their data, discovering subtle relationships and drawing critical new insights. In addition to full-text search, geospatial mapping, and multimedia processing, Lumify features a powerful graph visualization supporting sophisticated link analysis and complex knowledge representation.

The full story of SecureGraph isn’t here but the slides are enough to tempt me into finding out more.

You?

I first saw this in a tweet by Stephen Mallette.

Images Can Be Persuasive!

Filed under: Graphics,Visualization — Patrick Durusau @ 3:00 pm

Florence, Italy vs. Atlanta, GA

Florence Italy and hwy interchange Atlanta, same scale.

Just the image and identifying the locations is all that need be said!

What images would you contrast for topic maps and why?

I saw this in a tweet by Janek Hellqvist.

June 12, 2014

An incomplete list of classic papers…

Filed under: Computer Science — Patrick Durusau @ 8:15 pm

An incomplete list of classic papers every Software Architect should read

From the post:

Every one of us has their favourite papers in their domain. Every once in a while, we find a paper so fascinating that we want to share it with everyone.

Not all may agree it’s a good idea to read the original paper. Some might prefer a modern textbook exposition of it. Nevertheless a more detailed look to our past can be helpful when trying to understand the future, and provides us with a more polished understanding.

Below is a list of “classic” papers that have shaped computing history. Some of which will become classics (such as the bitcoin paper). Some of which were perceived radical perhaps, at the time, but turned out to influence terminology and became pillars of computer science.

If you have additional papers which you find missing, please post them as a comment (including reason for why you think they’re special) on this reddit thread.

Often seen as an apology for having invented the FORTRAN language, Backus’ [1978] Turing Award lecture was one of the most influential and now most-often cited papers advocating the functional programming paradigm. Backus coined the term “word-at-a-time programming” to capture the essence of imperative languages, showed how such languages were inextricably tied to the von Neumann machine, and gave a convincing argument why such languages were not going to meet the demands of modern software development. That this argument was being made by the person who is given the most credit for designing FORTRAN and who also had significant influence on the development of ALGOL led substantial weight to the functional thesis. The exposure given to Backus’ paper was one of the best things that could have happened to the field of functional programming, which at the time was certainly not considered mainstream.

I appreciate “classic” papers, particularly ones that support something I already think is correct. Like functional programming languages.

But, to get the most value from these papers, read them as though your cube mate asked for comments.

Yes they are “classics” but if we enshrine them to be cited and not read, we will gain very little from them.

Enjoy!

Importing CSV data into Neo4j…

Filed under: CSV,Graphs,Neo4j — Patrick Durusau @ 7:44 pm

Importing CSV data into Neo4j to make a graph by Samantha Zeitlin.

From the post:

Thanks to a friend who wants to help more women get into tech careers, last year I attended Developer Week, where I was impressed by a talk about Neo4j.

Graph databases excited me right away, since this is a concept I’ve used for brainstorming since 3rd grade, when my teachers Mrs. Nysmith and Weaver taught us to draw webbings as a way to take notes and work through logic puzzles.

Samantha is successful at importing CSV data into Neo4j but only after encountering an out-dated blog post, a stack overflow example and then learning there is a new version of the importer available.

True, many of us learned *nix from the man pages but while effective, I can’t really say it was an efficient way to learn *nix.

Most people have a task for your software. They are not seeking to mind meld with it or to take it up as a new religion.

Emphasize the ease of practical use of your software and you will gain devotees despite it being easy to use.

« Newer PostsOlder Posts »

Powered by WordPress