Another Word For It Patrick Durusau on Topic Maps and Semantic Diversity

December 24, 2013

‘Hadoop Illuminated’ Book

Filed under: Hadoop,MapReduce — Patrick Durusau @ 9:41 am

‘Hadoop Illuminated’ Book by Mark Kerzner and Sujee Maniyam.

From the webpage:

Gentle Introduction of Hadoop and Big Data

Get the book…

HTML – multipage

HTML : single page

PDF

We are writing a book on Hadoop with following goals and principles.

More of a great outline for a Hadoop book than a great Hadoop book at present.

However, it is also the perfect opportunity for you to try your hand at clear, readable introductory prose on Hadoop. (That isn’t as easy as it sounds.)

As a special treat, there is a Hadoop Coloring Book for Kids. (Send more art for the coloring book as well.)

I especially appreciate the coloring book because I don’t have any coloring books. Did I mention I have a small child coming to visit during the holidays? 😉

PS: Has anyone produced a sort algorithm coloring book?

December 23, 2013

Hiding Interrogation Manual – In Plain Sight

Filed under: News,Reporting,Security — Patrick Durusau @ 8:52 pm

You’ll Never Guess Where This FBI Agent Left a Secret Interrogation Manual by Nick Baumann.

From the post:

In a lapse that national security experts call baffling, a high-ranking FBI agent filed a sensitive internal manual detailing the bureau’s secret interrogation procedures with the Library of Congress, where anyone with a library card can read it.

For years, the American Civil Liberties Union fought a legal battle to force the FBI to release a range of documents concerning FBI guidelines, including this one, which covers the practices agents are supposed to employ when questioning suspects. Through all this, unbeknownst to the ACLU and the FBI, the manual sat in a government archive open to the public. When the FBI finally relented and provided the ACLU a version of the interrogation guidebook last year, it was heavily redacted; entire pages were blacked out. But the version available at the Library of Congress, which a Mother Jones reporter reviewed last week, contains no redactions.

The 70-plus-page manual ended up in the Library of Congress, thanks to its author, an FBI official who made an unexplainable mistake. This FBI supervisory special agent, who once worked as a unit chief in the FBI’s counterterrorism division, registered a copyright for the manual in 2010 and deposited a copy with the US Copyright Office, where members of the public can inspect it upon request. What’s particularly strange about this episode is that government documents cannot be copyrighted.

A bit further on in the story it is reported:

Because the two versions are similar, a side-by-side comparison allows a reader to deduce what was redacted in the later version. The copyright office does not allow readers to take pictures or notes, but during a brief inspection, a few redactions stood out.

See Nick’s story for the redactions but what puzzled me was the “does not allow readers to take pictures or notes…” line.

Turns out what Mother Jones should have done was contact the ACLU, who is involved in litigation over this item.

Why?

Because under Circular 6 of the Copyright Office, copies of a deposit can be obtained under three (3) conditions, one of which is:

The Copyright Office Litigation Statement Form is completed and received from an attorney or authorized representative in connection with litigation, actual or prospective, involving the copyrighted work. The following information must be included in such a request: (a) the names of all parties involved and the nature of the controversy, and (b) the name of the court in which the actual case is pending. In the case of a prospective proceeding, the requestor must give a full statement of the facts of controversy in which the copyrighted work is involved, attach any letter or other document that supports the claim that litigation may be instituted, and make satisfactory assurance that the requested reproduction will be used only in connection with the specified litigation.

Contact the Records Research and Certification Section for a Litigation Statement Form. This form must be used. No substitute will be permitted. The form must contain an original signature and all information requested for the Copyright Office to process a request.

You can also get a court order but this one looks like a custom fit for the ACLU case.

It is hard to argue the government is in bad faith while ignoring routine administrative procedures to obtain the information you seek.

PS: If you have any ACLU contacts, please forward this post to them.

If you have Mother Jones contacts, suggest to them the drill is to get the information first, then break the story. They seem to have gotten that backwards on this one.

Planar Graphs and Ternary Trees

Filed under: Graphs,Mathematics — Patrick Durusau @ 5:52 pm

Donald Knuth’s Annual Christmas Tree Lecture: Planar Graphs and Ternary Trees

From the description:

In this lecture, Professor Knuth discusses the beautiful connections between certain trees with three-way branching and graphs that can be drawn in the plane without crossing edges.

Additional resources that will be helpful:

From Knuth’s Programs to Read:

SKEW-TERNARY-CALC and a MetaPost file for its illustrations.
Computes planar graphs that correspond to ternary trees in an amazing way; here’s a PDF file for its documentation

Quad-edge (Wikipedia)

Quad-Edge Data Structure and Library by Paul Heckbert.

The Quad-Edge data structure is useful for describing the topology and geometry of polyhedra. We will use it when implementing subdivision surfaces (a recent, elegant way to define curved surfaces) because it is elegant and it can answer adjacency queries efficiently. In this document we describe the data structure and a C++ implementation of it.

I don’t think this will be immediately applicable to topic maps because planar graphs are embedded in a plane (or on a sphere) and their edges only intersect at nodes.

Thinking that scope requires the use a hyperedge. Yes?

However, the lecture is quite enjoyable and efficient data structures may inspire thoughts of new efficient data structures.

Graph for Scala

Filed under: Graphs,Hyperedges,Hypergraphs,Scala — Patrick Durusau @ 3:14 pm

Graph for Scala

From the webpage:

Welcome to scalax.collection.Graph

Graph for Scala provides basic graph functionality that seamlessly fits into the Scala standard collections library. Like members of scala.collection, graph instances are in-memory containers that expose a rich, user-friendly interface.

Graph for Scala also has ready-to-go implementations of JSON-Import/Export and Dot-Export. Database emulation and distributed graph processing are due to be supported.

Backed by the Scala core team, Graph for Scala started in 2011 as an open source project in the EPFL Scala incubator space on Assembla. Meanwhile it is also hosted on Github.

Want to take it for a spin? Grab the latest release to get started, then visit the Core User Guide (Warning: Broken Link)to learn more!

If you follow the “Core” option under “Users Guides” on the top menu bar, you will find: Core User Guide: Introduction, which reads in part:

Why Use Graph for Scala?

The most important reasons why Graph for Scala speeds up your development are:

  • Simplicity: Creating, manipulating and querying Graph is intuitive.
  • Consistency: Graph for Scala seamlessly maintains a consistent state of nodes and edges including prevention of duplicates, intelligent addition and removal.
  • Conformity: As a regular collection class, Graph has the same “look and feel” as other members of the Scala collection framework. Whenever appropriate, result types are Scala collection types themselves.
  • Flexibility: All kinds of graphs including mixed graphs, multi-graphs and hypergraphs are supported.
  • Functional Style: Graph for Scala facilitates a concise, functional style of utilizing graph functionality, including traversals, not seen in Java-based libraries.
  • Extendibility: You can easily customize Graph for Scala to reflect the needs of you application retaining all benefits of Graph.
  • Documentation: Ideal progress curve through adequate documentation.

Look and see!

You will find support for hyperedges, directed hyperedges, edges and directed edges.

Further documentation covers exporting to Dot, moving data into and out of JSON, and constraining graphs.

Where Does the Data Go?

Filed under: Data,Semantic Inconsistency,Semantics — Patrick Durusau @ 2:20 pm

Where Does the Data Go?

A brief editorial on The Availability of Research Data Declines Rapidly with Article Age by Timothy H. Vines, et.al., which reads in part:

A group of researchers in Canada examined 516 articles published between 1991 and 2011, and “found that availability of the data was strongly affected by article age.” For instance, the team reports that the odds of finding a working email address associated with a paper decreased by 7 percent each year and that the odds of an extant dataset decreased by 17 percent each year since publication. Some data was technically available, the researchers note, but stored on floppy disk or on zip drives that many researchers no longer have the hardware to access.

The one of highlights of the article (which appears in Current Biology) reads:

Broken e-mails and obsolete storage devices were the main obstacles to data sharing

Curious because I would have ventured that semantic drift over twenty (20) years would have been a major factor as well.

Then I read the paper and discovered:

To avoid potential confounding effects of data type and different research community practices, we focused on recovering data from articles containing morphological data from plants or animals that made use of a discriminant function analysis (DFA). [Under Results, the online edition has no page numbers]

The authors appeared to have dodged the semantic bullet by the selection of data and their non-reporting of difficulties, if any, in using the data (19.5%) that was shared by the original authors.

Preservation of data is a major concern for researchers but I would urge that the semantics of data be preserved as well.

Imagine that feeling when you “ls -l” a directory and recognize only some of the file names writ large. Writ very large.

December 22, 2013

Impala v Hive

Filed under: Cloudera,Hive,Impala — Patrick Durusau @ 9:12 pm

Impala v Hive by Mike Olson.

From the post:

We introduced Cloudera Impala more than a year ago. It was a good launch for us — it made our platform better in ways that mattered to our customers, and it’s allowed us to win business that was previously unavailable because earlier products simply couldn’t tackle interactive SQL workloads.

As a side effect, though, that launch ignited fierce competition among vendors for SQL market share in the Apache Hadoop ecosystem, with claims and counter-claims flying. Chest-beating on performance abounds (and we like our numbers pretty well), but I want to approach the matter from a different direction here.

I get asked all the time about Cloudera’s decision to develop Impala from the ground up as a new project, rather than improving the existing Apache Hive project. If there’s existing code, the thinking goes, surely it’s best to start there — right?

Well, no. We thought long and hard about it, and we concluded that the best thing to do was to create a new open source project, designed on different principles from Hive. Impala is that system. Our experiences over the last year increase our conviction on that strategy.

Let me walk you through our thinking.

Mike makes a very good argument for building Impala.

Whether you agree with it or not, it centers on requirements and users.

I won’t preempt his argument here but suffice it to say that Cloudera saw the need for robust SQL support over Hadoop data stores and estimated user demand for a language like SQL versus a newer language like Pig.

Personally I found it refreshing for someone to explicitly consider user habits as opposed to a “…users need to learn the right way (my way) to query/store/annotate data…” type approach.

You know the outcome, now go read the reasons Cloudera made the decisions it did.

Spectrograms with Overtone

Filed under: Clojure,Music — Patrick Durusau @ 8:55 pm

Spectrograms with Overtone by mikera7.

From the post:

spectrograms are fascinating: the ability to visualise sound in terms of its constituent frequencies. I’ve been playing with Overtone lately, so decided to create a mini-library to produce spectrograms from Overtone buffers.

spectrogram

This particular image is a visualisation of part of a trumpet fanfare. I like it because you can clearly see the punctuation of the different notes, and the range of strong harmonics above the base note. Read on for some more details on how this works.

Spectrograms (Wikipedia), Reading Spectrograms, and Spek – Acoustic Spectrum Analyser, are just a few of the online resources on spectograms.

Here’s your chance to experiment with a widely used technique (spectrograms) and practice with Clojure as well.

A win-win situation!

The sound of sorting…

Filed under: Algorithms,Programming,Sorting,Visualization — Patrick Durusau @ 8:33 pm

The sound of sorting – 15 sorting algorithms visualized and sonified by Alex Popescu.

Alex has embedded a YouTube video that visualizes and sonifies 15 sorting algorithms.

As a special treat, Alex links to more details on the video.

If you are interested in more visualizations of algorithms, see Algoviz.org.

Twitter Weather Radar – Test Data for Language Analytics

Filed under: Analytics,Language,Tweets,Weather Data — Patrick Durusau @ 8:17 pm

Twitter Weather Radar – Test Data for Language Analytics by Nicholas Hartman.

From the post:

Today we’d like to share with you some fun charts that have come out of our internal linguistics research efforts. Specifically, studying weather events by analyzing social media traffic from Twitter.

We do not specialize in social media and most of our data analytics work focuses on the internal operations of leading organizations. Why then would we bother playing around with Twitter data? In short, because it’s good practice. Twitter data mimics a lot of the challenges we face when analyzing the free text streams generated by complex processes. Specifically:

  • High Volume: The analysis represented here is looking at around 1 million tweets a day. In the grand scheme of things, that’s not a lot but we’re intentionally running the analysis on a small server. That forces us to write code that rapidly assess what’s relevant to the question we’re trying to answer and what’s not. In this case the raw tweets were quickly tested live on receipt with about 90% of them discarded. The remaining 10% were passed onto the analytics code.
  • Messy Language: A lot of text analytics exercises I’ve seen published use books and news articles as their testing ground. That’s fine if you’re trying to write code to analyze books or news articles, but most of the world’s text is not written with such clean and polished prose. The types of text we encounter (e.g., worklogs from an IT incident management system) are full of slang, incomplete sentences and typos. Our language code needs to be good and determining the messages contained within this messy text.
  • Varying Signal to Noise: The incoming stream of tweets will always contain a certain percentage of data that isn’t relevant to the item we’re studying. For example, if a band member from One Direction tweets something even tangentially related to what some code is scanning for the dataset can be suddenly overwhelmed with a lot of off-topic tweets. Real world data is similarly has a lot of unexpected noise.

In the exercise below, tweets from Twitter’s streaming API JSON stream were scanned in near real-time for their ability to 1) be pinpointed to a specific location and 2) provide potential details on local weather conditions. The vast majority of tweets passing through our code failed to meet both of these conditions. The tweets that remained were analyzed to determine the type of precipitation being discussed.

An interesting reminder that data to test your data mining/analytics is never far away.

If not Twitter, pick one of the numerous email archives or open data datasets.

The post doesn’t offer any substantial technical details but then you need to work those out for yourself.

The Taxonomy of Terrible Programmers

Filed under: Humor,Programming — Patrick Durusau @ 7:58 pm

The Taxonomy of Terrible Programmers by Aaron Stannard.

From the post:

The MarkedUp Analytics team had some fun over the past couple of weeks sharing horror stories about software atrocities and the real-life inspirations for the things you read on The Daily WTF. In particular, we talked about bad apples who joined our development teams over the years and proceeded to ruin the things we love with poor judgment, bad habits, bad attitudes, and a whole lot of other bizarre behavior that would take industrial pyschologists thousands of years to document, let alone analyze.

So I present you with the taxonomy of terrible software developers, the ecosystem of software critters and creatures who add a whole new meaning to the concept of “defensive programming.”

At one point or another, every programmer exists as at least one of these archetypes – the good ones see these bad habits in themselves and work to fix them over time. The bad ones… simply are.

You need to see Aaron’s post for the details but I will list the categories to whet your appetite:

  • The Pet Technologist
  • The Arcanist
  • The Futurist
  • The Hoarder
  • The Artist
  • The Island
  • The “Agile” Guy
  • The Human Robot
  • The Stream of Consciousness
  • The Illiterate
  • The Agitator

Enjoy!

Creating Data from Text…

Filed under: Data Mining,OpenRefine,Text Mining — Patrick Durusau @ 7:42 pm

Creating Data from Text – Regular Expressions in OpenRefine by Tony Hirst.

From the post:

Although data can take many forms, when generating visualisations, running statistical analyses, or simply querying the data so we can have a conversation with it, life is often made much easier by representing the data in a simple tabular form. A typical format would have one row per item and particular columns containing information or values about one specific attribute of the data item. Where column values are text based, rather than numerical items or dates, it can also help if text strings are ‘normalised’, coming from a fixed, controlled vocabulary (such as items selected from a drop down list) or fixed pattern (for example, a UK postcode in its ‘standard’ form with a space separating the two parts of the postcode).

Tables are also quick to spot as data, of course, even if they appear in a web page or PDF document, where we may have to do a little work to get the data as displayed into a table we can actually work with in a spreadsheet or analysis package.

More often than not, however, we come across situations where a data set is effectively encoded into a more rambling piece of text. One of the testbeds I used to use a lot for practising my data skills was Formula One motor sport, and though I’ve largely had a year away from that during 2013, it’s something I hope to return to in 2014. So here’s an example from F1 of recreational data activity that provided a bit of entertainment for me earlier this week. It comes from the VivaF1 blog in the form of a collation of sentences, by Grand Prix, about the penalties issued over the course of each race weekend. (The original data is published via PDF based press releases on the FIA website.)

This is a great step-by-step extraction of data example using regular expressions in OpenRefine.

If you don’t know OpenRefine, you should.

Debating possible or potential semantics is one thing.

Extracting, processing, and discovering the semantics of data is another.

In part because the latter is what most clients are willing to pay for. 😉

PS: Using OpenRefine is on sale now in eBook version for $5.00 http://www.packtpub.com/openrefine-guide-for-data-analysis-and-linking-dataset-to-the-web/book A tweet from Packt Publishing says the sale is on through January 3, 2014.

…electronic laboratory notebook records

Filed under: Cheminformatics,ELN Integration,Science,Semantics — Patrick Durusau @ 7:29 pm

First steps towards semantic descriptions of electronic laboratory notebook records by Simon J Coles, Jeremy G Frey, Colin L Bird, Richard J Whitby and Aileen E Day.

Abstract:

In order to exploit the vast body of currently inaccessible chemical information held in Electronic Laboratory Notebooks (ELNs) it is necessary not only to make it available but also to develop protocols for discovery, access and ultimately automatic processing. An aim of the Dial-a-Molecule Grand Challenge Network is to be able to draw on the body of accumulated chemical knowledge in order to predict or optimize the outcome of reactions. Accordingly the Network drew up a working group comprising informaticians, software developers and stakeholders from industry and academia to develop protocols and mechanisms to access and process ELN records. The work presented here constitutes the first stage of this process by proposing a tiered metadata system of knowledge, information and processing where each in turn addresses a) discovery, indexing and citation b) context and access to additional information and c) content access and manipulation. A compact set of metadata terms, called the elnItemManifest, has been derived and caters for the knowledge layer of this model. The elnItemManifest has been encoded as an XML schema and some use cases are presented to demonstrate the potential of this approach.

And the current state of electronic laboratory notebooks:

It has been acknowledged at the highest level [15] that “research data are heterogeneous, often classified and cited with disparate schema, and housed in distributed and autonomous databases and repositories. Standards for descriptive and structural metadata will help establish a common framework for understanding data and data structures to address the heterogeneity of datasets.” This is equally the case with the data held in ELNs. (citing: 15. US National Science Board report, Digital Research Data Sharing and Management, Dec 2011 Appendix F Standards and interoperability enable data-intensive science. http://www.nsf.gov/nsb/publications/2011/nsb1124.pdf, accessed 10/07/2013.)

It is trivially true that: “…a common framework for understanding data and data structures …[would] address the heterogeneity of datasets.”

Yes, yes a common framework for data and data structures would solve the heterogeneity issues with datasets.

What is surprising is that no one had that idea up until now. 😉

I won’t recite the history of failed attempts at common frameworks for data and data structures here. To the extent that communities do adopt common practices or standards, those do help. Unfortunately there have never been any universal ones.

Or should I say there have never been any proposals for universal frameworks that succeeded in becoming universal? That’s more accurate. We have not lacked for proposals for universal frameworks.

That isn’t to say this is a bad proposal. But it will be only one of many proposals for the integration of electronic laboratory notebook records, leaving the task of integration between systems for integration left to be done.

BTW, if you are interested in further details, see the article and the XML schema at: http://www.dial-a-molecule.org/wp/blog/2013/08/elnitemmanifest-a-metadata-schema-for-accessing-and-processing-eln-records/.

…2013 World Ocean Database…

Filed under: Government Data,Oceanography,Science — Patrick Durusau @ 4:44 pm

NOAA releases 2013 World Ocean Database: The largest collection of scientific information about the oceans

From the post:

NOAA has released the 2013 World Ocean Database, the largest, most comprehensive collection of scientific information about the oceans, with records dating as far back as 1772. The 2013 database updates the 2009 version and contains nearly 13 million temperature profiles, compared with 9.1 in the 2009 database, and just fewer than six million salinity measurements, compared with 3.5 in the previous database. It integrates ocean profile data from approximately 90 countries around the world, collected from buoys, ships, gliders, and other instruments used to measure the “pulse” of the ocean.

Profile data of the ocean are measurements taken at many depths, from the surface to the floor, at a single location, during the time it takes to lower and raise the measuring instruments through the water. “This product is a powerful tool being used by scientists around the globe to study how changes in the ocean can impact weather and climate,” said Tim Boyer, an oceanographer with NOAA’s National Oceanographic Data Center.

In addition to using the vast amount of temperature and salinity measurements to monitor changes in heat and salt content, the database captures other measurements, including: oxygen, nutrients, chlorofluorocarbons and chlorophyll, which all reveal the oceans’ biological structure.

For the details on this dataset see: WOD Introduction.

The introduction notes under 1.1.5 Data Fusion:

It is not uncommon in oceanography that measurements of different variables made from the same sea water samples are often maintained as separate databases by different principal investigators. In fact, data from the same oceanographic cast may be located at different institutions in different countries. From its inception, NODC recognized the importance of building oceanographic databases in which as much data from each station and each cruise as possible are placed into standard formats, accompanied by appropriate metadata that make the data useful to future generations of scientists. It was the existence of such databases that allowed the International Indian Ocean Expedition Atlas (Wyrtki, 1971) and Climatological Atlas of the World Ocean (Levitus, 1982) to be produced without the time-consuming, laborious task of gathering data from many different sources. Part of the development of WOD13 has been to expand this data fusion activity by increasing the number of variables that NODC/WDC makes available as part of standardized databases.

As the NODC (National Oceanographic Data Center) demonstrates, it is possible to curate data sources in order to present a uniform data collection.

But curated data set remains inconsistent with data sets not curated by the same authority.

And combining curated data with non-curated data requires effort with the curated data, again.

Hard to map towards a destination without knowing its location.

Topic maps can capture the basis for curation, which will enable faster and more accurate integration of foreign data sets in the future.

Clojure Cookbook – Update

Filed under: Clojure,Functional Programming,Programming — Patrick Durusau @ 3:52 pm

Clojure Cookbook: Recipes for Functional Programming by Luke vanderHart and Ryan Neufeld.

clojurecookbook

In June of 2013 I pointed you to: GitHub clojure-cookbook for the project developing this book.

O’reilly has announced that the early release version is now available and the projected print version is due out in March of 2014 (est.).

If you have comments on the text, best get them in sooner rather than later!

December 21, 2013

Deconstructing Functional Programming

Filed under: Dart,Functional Programming,Newspeak — Patrick Durusau @ 8:49 pm

Deconstructing Functional Programming by Gilad Bracha.

From the summary and bio:

Summary

Gilad Bracha explains how to distinguish FP hype from reality and to apply key ideas of FP in non-FP languages, separating the good parts of FP from its unnecessary cultural baggage.

Bio

Gilad Bracha is the creator of the Newspeak programming language and a software engineer at Google where he works on Dart. Previously, he was a VP at SAP Labs, a Distinguished Engineer at Cadence, and a Computational Theologist and Distinguished Engineer at Sun. He is co-author of the Java Language Specification, and a researcher in the area of object-oriented programming languages.

A very enjoyable presentation!

I really like the title in the bio: Computational Theologist.

Further resources:

Dart Language site.

Room 101 Gilad’s blog.

Newspeak Language site.

…Titan Cluster on Cassandra and ElasticSearch on AWS EC2

Filed under: Cassandra,ElasticSearch,Graphs,Titan — Patrick Durusau @ 8:10 pm

Setting up a Titan Cluster on Cassandra and ElasticSearch on AWS EC2 by Jenny Kim.

From the post:

This purpose of this post is to provide a walkthrough of a Titan cluster setup and highlight some key gotchas I’ve learned along the way. This walkthrough will utilize the following versions of each software package:

Versions

The cluster in this walkthrough will utilize 2 M1.Large instances, which mirrors our current Staging cluster setup. A typical production graph cluster utilizes 4 M1.XLarge instances.

NOTE: While the Datastax Community AMI requires at minimum, M1.Large instances, the exact instance-type and cluster size should depend on your expected graph size, concurrent requests, and replication and consistency needs.

Great post!

You will be gaining experience with cloud computing along with very high end graph software (Titan).

…Stinger Phase 3 Technical Preview

Filed under: Hortonworks,STINGER,Tez — Patrick Durusau @ 7:59 pm

Announcing Stinger Phase 3 Technical Preview by Carter Shanklin.

From the post:

As an early Christmas present, we’ve made a technical preview of Stinger Phase 3 available. While just a preview by moniker, the release marks a significant milestone in the transformation of Hadoop from a batch-oriented system to a data platform capable of interactive data processing at scale and delivering on the aims of the Stinger Initiative.

Apache Tez and SQL: Interactive Query-IN-Hadoop

stinger-phase-3
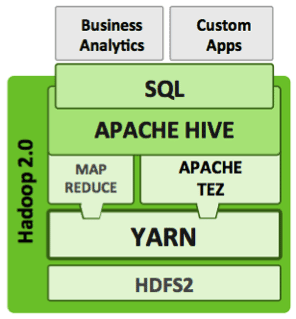
Tez is a low-level runtime engine not aimed directly at data analysts or data scientists. Frameworks need to be built on top of Tez to expose it to a broad audience… enter SQL and interactive query in Hadoop.

Stinger Phase 3 Preview combines the Tez execution engine with Apache Hive, Hadoop’s native SQL engine. Now, anyone who uses SQL tools in Hadoop can enjoy truly interactive data query and analysis.

We have already seen Apache Pig move to adopt Tez, and we will soon see others like Cascading do the same, unlocking many forms of interactive data processing natively in Hadoop. Tez is the technology that takes Hadoop beyond batch and into interactive, and we’re excited to see it available in a way that is easy to use and accessible to any SQL user.

….

Further on in the blog Carter mentions that for real fun you need four (4) physical nodes and a fairly large dataset.

I have yet to figure out the price break point between a local cluster and using a cloud service. Suggestions on that score?

Class Scheduling [Tutorial FoundationDB]

Filed under: FoundationDB,Java,Programming,Python,Ruby — Patrick Durusau @ 7:22 pm

Class Scheduling

From the post:

This tutorial provides a walkthrough of designing and building a simple application in Python using FoundationDB. In this tutorial, we use a few simple data modeling techniques. For a more in-depth discussion of data modeling in FoundationDB, see Data Modeling.

The concepts in this tutorial are applicable to all the languages supported by FoundationDB. If you prefer, you can see a version of this tutorial in:

The offering of the same tutorial in different languages looks like a clever idea.

Like using a polyglot edition of the Bible with parallel original text and translations.

In a polyglot, the associations between words in different languages are implied rather than explicit.

Accumulo Comes to CDH

Filed under: Accumulo,Cloudera,Hadoop,NSA — Patrick Durusau @ 7:11 pm

Accumulo Comes to CDH by by Sean Busbey, Bill Havanki, and Mike Drob.

From the post:

Cloudera is pleased to announce the immediate availability of its first release of Accumulo packaged to run under CDH, our open source distribution of Apache Hadoop and related projects and the foundational infrastructure for Enterprise Data Hubs.

Accumulo is an open source project that provides the ability to store data in massive tables (billions of rows, millions of columns) for fast, random access. Accumulo was created and contributed to the Apache Software Foundation by the National Security Agency (NSA), and it has quickly gained adoption as a Hadoop-based key/value store for applications that require access to sensitive data sets. Cloudera provides enterprise support with the RTD Accumulo add-on subscription for Cloudera Enterprise.

This release provides Accumulo 1.4.3 tested for use under CDH 4.3.0. The release includes a significant number of backports and fixes to allow use with CDH 4’s highly available, production-ready packaging of HDFS. As a part of our commitment to the open source community, these changes have been submitted back upstream.

At least with Accumulo, you know you are getting NSA vetted software.

Can’t say the same thing for RSA software.

Enterprise customers need to demand open source software that reserves commercial distribution rights to its source.

For self-preservation if no other reason.

Google Transparency Report

Filed under: Marketing,Search Behavior,Search Data,Search History,Transparency — Patrick Durusau @ 5:32 pm

Google Transparency Report

The Google Transparency Report consists of five parts:

  1. Government requests to remove content

    A list of the number of requests we receive from governments to review or remove content from Google products.

  2. Requests for information about our users

    A list of the number of requests we received from governments to hand over user data and account information.

  3. Requests by copyright owners to remove search results

    Detailed information on requests by copyright owners or their representatives to remove web pages from Google search results.

  4. Google product traffic

    The real-time availability of Google products around the world, historic traffic patterns since 2008, and a historic archive of disruptions to Google products.

  5. Safe Browsing

    Statistics on how many malware and phishing websites we detect per week, how many users we warn, and which networks around the world host malware sites.

I pointed out the visualizations of the copyright holder data earlier today.

There are a number of visualizations of the Google Transparency Report and I may assemble some of the more interesting ones for your viewing pleasure.

You certainly should download the data sets and/or view them as Google Docs Spreadsheets.

I say that because while Google is more “transparent” than the current White House, it’s not all that transparent at all.

Take the government take down requests for example.

According to the raw data file, the United States has made five (5) requests on the basis of national security, four (4) of which were for YouTube videos and one (1) was for one web search result.

Really?

And for no government request, is there sufficient information to identify the information that any government sought to conceal.

Google may have qualms about information governments want to conceal but that sounds like a marketing opportunity to me. (Being mindful of your availability to such governments.)

Document visualization: an overview of current research

Filed under: Data Explorer,Graphics,Text Mining,Visualization — Patrick Durusau @ 3:13 pm

Document visualization: an overview of current research by Qihong Gan, Min Zhu, Mingzhao Li, Ting Liang, Yu Cao, Baoyao Zhou.

Abstract:

As the number of sources and quantity of document information explodes, efficient and intuitive visualization tools are desperately needed to assist users in understanding the contents and features of a document, while discovering hidden information. This overview introduces fundamental concepts of and designs for document visualization, a number of representative methods in the field, and challenges as well as promising directions of future development. The focus is on explaining the rationale and characteristics of representative document visualization methods for each category. A discussion of the limitations of our classification and a comparison of reviewed methods are presented at the end. This overview also aims to point out theoretical and practical challenges in document visualization.

The authors evaluate document visualization methods against the following goals:

  • Overview. Gain an overview of the entire collection.
  • Zoom. Zoom in on items of interest.
  • Filter. Filter out uninteresting items.
  • Details-on-demand. Select an item or group and get details when needed.
  • Relate. View relationship among items.
  • History. Keep a history of actions to support undo, replay, and progressive refinement.
  • Extract. Allow extraction of sub-collections and of the query parameters.

A useful review of tools for exploring texts!

CDK Becomes “Kite SDK”

Filed under: Cloudera,Hadoop — Patrick Durusau @ 1:44 pm

Cloudera Development Kit is Now “Kite SDK” by Ryan Blue.

From the post:

CDK has a new monicker, but the goals remain the same.

We are pleased to announce a new name for the Cloudera Development Kit (CDK): Kite. We’ve just released Kite version 0.10.0, which is purely a rename of CDK 0.9.0.

The new repository and documentation are here:

Why the rename?

The original goal of CDK was to increase accessibility to the Apache Hadoop platform by developers. That goal isn’t Cloudera-specific, and we want the name to more forcefully reflect the open, community-driven character of the project.

Will this change break anything?

The rename mainly affects dependencies and package names. Once imports and dependencies are updated, almost everything should work the same. However, there are a couple of configuration changes to make for anyone using Apache Flume or Morphlines. The changes are detailed on our migration page.

The continuation of the Kite SDK version 0.10.0 along side the Cloudera Development Kit 0.9.0, should make some aspects of the name transition easier.

However, when you search for CDK 0.9.0, are you going to get “hits” for the Kite SDK 0.10.0? Such as blog posts, tutorials, code, etc.

I suspect not. The reverse won’t work either.

So we have relevant material that is indexed under two different names, names a user will have to remember in order to get all the relevant results.

Defining a synonym table works for cases like this but does have one shortfall.

Will the synonym table make sense to us in ten (10) years? Or in twenty (20) years?

There is no guarantee that even a synonym mapping based on disclosed properties will remain intelligible for X number of years.

But if long term data access is mission critical, something more than blind synonym mappings needs to be done.

Who Owns This Data?

Filed under: Data — Patrick Durusau @ 10:43 am

Visualizing Google’s million-row copyright claim dataset by Derrick Harris.

From the post:

Google released its latest transparency report on Thursday, and while much coverage of those reports rightfully focuses on governmental actions — requests for user data and requests to remove content — Google is also providing a trove of copyright data. In fact, the copyright section of its transparency report includes a massive, nearly 1-million-row dataset regarding claims of copyright infringement on URLs. (You can download all the data here. Unfortunately, it doesn’t include YouTube data, just search.) Here are some charts highlighting which copyright owners have been the most active since 2011.

The top four (4) takedown artists were:

  • The British Recorded Music Industry
  • The Recording Industry Association of America
  • Porn copyright owner Froytal Services
  • Fox

Remember that the next time copyright discussions come up.

Copyright protects music companies (not artists), porn and Fox.

Makes you wish the copyright period was back at seven (7) years doesn’t it?

Advanced R Programming – Update

Filed under: Programming,R — Patrick Durusau @ 10:17 am

I reported Hadley Wickham’s posting of his in-progress book, Advanced R programming back in September of 2013.

Hadley has now posted the code and slides for his two-day tutorial on advanced R programming!

Day 1: Advanced R Programming Tutorial.

Day 2: Advanced R Programming Tutorial.

His book is due to be published in the R series by Chapman & Hall/CRC.

Due out in 2014, when it is published, be sure to send a note to your local librarian.

December 20, 2013

Principles of Solr application design

Filed under: Searching,Solr — Patrick Durusau @ 7:35 pm

Principles of Solr application design – part 1 of 2

Principles of Solr application design – part 2 of 2

From part 1:

We’ve been working internally on a document encapsulating how we build (and recommend others should build) search applications based on Apache Solr, probably the most popular open source search engine library. As an early Christmas present we’re releasing these as a two part series – if you have any feedback we’d welcome comments! So without further ado here’s the first part:

Over two posts you get thirteen (13) points to check off while building a Solr application.

You won’t find anything startling but it will make a useful checklist.

Solr Cluster

Filed under: LucidWorks,Search Engines,Searching,Solr — Patrick Durusau @ 7:30 pm

Solr Cluster

From the webpage:

Join us weekly for tips and tricks, product updates and Q&A on topics you suggest. Guest appearances from Lucene/Solr committers and PMC members. Send questions to SolrCluster@lucidworks.com

So far:

#1 Entity Recognition

Enhance Search applications beyond simple keyword search by adding intelligence through metadata. Help classify common patterns from unstructured data/content into predefined categories. Examples include names of persons, organizations, locations, expressions of time, quantities, monetary values, percentages etc. Entity recognition is usually built using either linguistic grammar-based techniques or statistical models.

#2 On Enterprise and Intranet Search

What use is search to an enterprise? What is the purpose of intranet search? How hard is it to implement? In this episode we speak with LucidWorks consultant Evan Sayer about the benefits of internal search and how to prepare your business data to best take advantage of full-text search.

Well, the lead in music isn’t Beaker Street, but it’s not that long.

I think the discussion would be easier to follow with a webpage with common terms and an outline of the topic for the day.

Has real potential so I urge you to listen, send in questions and comments.

Search …Business Critical in 2014

Filed under: Merging,Search Requirements,Searching,Topic Maps — Patrick Durusau @ 7:14 pm

Search Continues to Be Business Critical in 2014 by Martin White.

From the post:

I offer two topics that I see becoming increasingly important in 2014. One of these is cross-device search, where a search is initially conducted on a desktop and is continued on a smartphone, and vice-versa. There is a very good paper from Microsoft that sets out some of the issues. The second topic is continuous information seeking, where search tasks are carried out by more than one “searcher,” often in support of collaborative working. The book on this topic by Chirag Shah, a member of staff of Rutgers University, is a very good place to start.

Editor’s Note: Read more of Martin’s thoughts on search in Why All Search Projects Fail.

Gee, let me see, what would more than one searcher need to make their collaborative search results usable by the entire team?

Can you say merging? 😉

Martin has other, equally useful insights in the search space so don’t miss the rest of his post.

But also catch his “Why All Search Projects Fail.” Good reading before you sign a contract with a client.

3rd Annual Federal Big Data Apache Hadoop Forum

Filed under: BigData,Cloudera,Conferences,Hadoop — Patrick Durusau @ 6:59 pm

3rd Annual Federal Big Data Apache Hadoop Forum

From the webpage:

Registration is now open for the third annual Federal Big Data Apache Hadoop Forum! Join us on Thurs., Feb. 6, as leaders from government and industry convene to share Big Data best practices. This is a must attend event for any organization or agency looking to be information-driven and give access to more data to more resources and applications. During this informative event you will learn:

  • Key trends in government today and the role Big Data plays in driving transformation;
  • How leading agencies are putting data to good use to uncover new insight, streamline costs, and manage threats;
  • The role of an Enterprise Data Hub, and how it is a game changing data management platform central to any Big Data strategy today.

Get the most from all your data assets, analytics, and teams to enable your mission, efficiently and on budget. Register today and discover how Cloudera and an Enterprise Data Hub can empower you and your teams to do more with Big Data.

A Cloudera fest but I don’t think they will be searching people for business cards at the door. 😉

An opportunity for you to meet and greet, make contacts, etc.

I first saw this in a tweet by Bob Gourley.

The NSA Knows If You’ve Been Bad Or Good…

Filed under: NSA,Security — Patrick Durusau @ 4:31 pm

NSA and Britain’s GCHQ targeted aid groups and top EU, Israeli and African officials by David Meyer.

From the post:

Another day, another addition to our pool of knowledge regarding U.S. and British surveillance activities. According to the Guardian, Der Spiegel and New York Times, historical targets of the intelligence agencies have included (deep breath): Unicef, Médecins du Monde, the UN development program, the UN food program, the UN Institute for Disarmament Research, Israel’s former prime minister and defense secretary, the head of the Economic Community of West African States (Ecowas), other African leaders and their families, French defense contractor Thales, French oil giant Total, and EU competition chief Joaquin Almunia — although he was in charge of the EU economy at the time. File under “Diplomatic Disasters”.

Perhaps the reason the NSA has gained so little intelligence from its wide spread snooping is that it is looking in the wrong places. Yes?

The UN food program?

What about wealthy Saudis? I understand at least one Saudi was a self-announced terrorist. (Osama bin Laden)

That’s one more than you can say for the UN food program.

The incompetence and waste of the current intelligence efforts are more pressing issues to me than the invasions of privacy.

The intelligence-industrial complex, I2C, is fighting a war against enemies that only it can see, by means only it can know about, for a cost that it can’t disclose and/or justify.

In some ways, the I2C poses a greater danger than the military-industrial complex. At least with the military-industrial compex the drama was being played out to some degree in public. Lots of lies were told privately but there were visible enemies.

With the I2C, anyone, your neighbor, co-worker, brother-in-law, etc., could be the enemy! (It sounds absurd when I say it, but the nodding heads on TV treat the same statement from the President on down as thought its sensible.)

It’s time to end this carnival scare ride called the war on terrorism. The only people making money are the ticket takers and the money being spent is yours.

December 19, 2013

The Scourge of Unnecessary Complexity

Filed under: Complexity,Writing — Patrick Durusau @ 8:03 pm

The Scourge of Unnecessary Complexity by Stephen Few.

From the post:

One of the mottos of my work is “eloquence through simplicity:” eloquence of communication through simplicity of design. Simple should not be confused with simplistic (overly simplified). Simplicity’s goal is to find the simplest way to represent something, stripping away all that isn’t essential and expressing what’s left in the clearest possible way. It is the happy medium between too much and too little.

While I professionally strive for simplicity in data visualization, I care about it in all aspects of life. Our world is overly complicated by unnecessary and poorly expressed information and choices, and the problem is getting worse in our so-called age of Big Data. Throughout history great thinkers have campaigned for simplicity. Steve Jobs was fond of quoting Leonardo da Vinci: “Simplicity is the ultimate sophistication.” Never has the need for such a campaign been greater than today.

A new book, Simple: Conquering the Crisis of Complexity, by Alan Siegal and Irene Etzkorn, lives up to its title by providing a simple overview of the need for simplicity, examples of simplifications that have already enriched our lives (e.g., the 1040EZ single-page tax form that the authors worked with the IRS to design), and suggestions for what we can all do to simplify the world. This is a wonderful book, filled with information that’s desperately needed.

Too late for Christmas but I have a birthday coming up. 😉

Sounds like a great read and a lesson to be repeated often.

Complex documentation and standards only increase the cost of using software or implementing standards.

Whose interest is advanced by that?

« Newer PostsOlder Posts »

Powered by WordPress