Another Word For It Patrick Durusau on Topic Maps and Semantic Diversity

October 21, 2013

7 command-line tools for data science

Filed under: Data Mining,Data Science,Extraction — Patrick Durusau @ 4:54 pm

7 command-line tools for data science by Jeroen Janssens.

From the post:

Data science is OSEMN (pronounced as awesome). That is, it involves Obtaining, Scrubbing, Exploring, Modeling, and iNterpreting data. As a data scientist, I spend quite a bit of time on the command-line, especially when there's data to be obtained, scrubbed, or explored. And I'm not alone in this. Recently, Greg Reda discussed how the classics (e.g., head, cut, grep, sed, and awk) can be used for data science. Prior to that, Seth Brown discussed how to perform basic exploratory data analysis in Unix.

I would like to continue this discussion by sharing seven command-line tools that I have found useful in my day-to-day work. The tools are: jq, json2csv, csvkit, scrape, xml2json, sample, and Rio. (The home-made tools scrape, sample, and Rio can be found in this data science toolbox.) Any suggestions, questions, comments, and even pull requests are more than welcome.

Jeroen covers:

  1. jq – sed for JSON
  2. json2csv – convert JSON to CSV
  3. csvkit – suite of utilities for converting to and working with CSV
  4. scrape – HTML extraction using XPath or CSS selectors
  5. xml2json – convert XML to JSON
  6. sample – when you’re in debug mode
  7. Rio – making R part of the pipeline

There are fourteen (14) more suggested by readers at the bottom of the post.

Some definite additions to the tool belt here.

I first saw this in Pete Warden’s Five Short Links, October 19, 2013.

DifferenceBetween.com [Humans Only]

Filed under: Dictionary,Disambiguation — Patrick Durusau @ 4:38 pm

DifferenceBetween.com

From the About page:

Life is full of choices to make, so are the differences. Differentiation is the identity of a person or any item.

Throughout our life we have to make number of choices. To make the right choice we need to know what makes one different from the other.

We know that making the right choice is the hardest task we face in our life and we will never be satisfied with what we chose, we tend to think the other one would have been better. We spend a lot of time on making decision between A and B.

And the information that guide us to make the right choice should be unbiased, easily accessible, freely available, no hidden agendas and have to be simple and self explanatory, while adequately informative. Information is everything in decision making. That’s where differencebetween.com comes in. We make your life easy by guiding you to distinguish the differences between anything and everything, so that you can make the right choices.

Whatever the differences you want to know, be it about two people, two places, two items, two concepts, two technologiesor whatever it is, we have the answer. We have not confined ourselves in to limits. We have a very wide collection of information, that are diverse, unbiased and freely available. In our analysis we try to cover all the areas such as what is the difference, why the difference and how the difference affect.

What we do at DifferentBetween.com, we team up with selected academics, subject matter experts and script writers across the world to give you the best possible information in differentiating any two items.

Easy Search: We have added search engine for viewers to go direct to the topic they are searching for, without browsing page by page.

Sam Hunting forwarded this to my attention.

I listed it under dictionary and disambiguation but I am not sure either of those is correct.

Just a sampling:

And my current favorite:

Difference Between Lucid Dreaming and Astral Projection

Never has occurred to me to confuse those two. 😉

There are over five hundred and twenty (520) pages and assuming an average of sixteen (16) entries per page, there are over eight thousand (8,000) entries today.

Unstructured prose is used to distinguish one subject from another, rather than formal properties.

Being human really helps with the distinctions given in the articles.

Denotational Semantics

Filed under: Denotational Semantics,Programming,Semantics — Patrick Durusau @ 3:53 pm

Denotational Semantics: A Methodology for Language Development by David A. Schmidt.

From the Preface:

Denotational semantics is a methodology for giving mathematical meaning to programming languages and systems. It was developed by Christopher Strachey’s Programming Research Group at Oxford University in the 1960s. The method combines mathematical rigor, due to the work of Dana Scott, with notational elegance, due to Strachey. Originally used as an analysis tool, denotational semantics has grown in use as a tool for language design and implementation.

This book was written to make denotational semantics accessible to a wider audience and to update existing texts in the area. I have presented the topic from an engineering viewpoint, emphasizing the descriptional and implementational aspects. The relevant mathematics is also included, for it gives rigor and validity to the method and provides a foundation for further research.

The book is intended as a tutorial for computing professionals and as a text for university courses at the upper undergraduate or beginning graduate level. The reader should be acquainted with discrete structures and one or more general purpose programming languages. Experience with an applicative-style language such as LISP, ML, or Scheme is also helpful.

You can document the syntax of a programming language using some variation of BNF.

Documenting the semantics of a programming language is a bit tougher.

Denotational semantics is one approach. Other approaches include: Axiomatic semantics and Operational semantics.

Even if you are not interested in proving the formal correctness of program, the mental discipline required by any of these approaches is useful.

Design Fractal Art…

Filed under: Complexity,Fractals — Patrick Durusau @ 3:21 pm

Design Fractal Art on the Supercomputer in Your Pocket

fractal

From the post:

Fractals are deeply weird: They’re mathematical objects whose infinite “self-similarity” means that you can zoom into them forever and keep seeing the same features over and over again. Famous fractal patterns like the Mandelbrot set tend to get glossed over by the general public as neato screensavers and not much else, but now a new iOS app called Frax is attempting to bridge that gap.

Frax, to its credit, leans right into the “ooh, neat colors!” aspect of fractal math. The twist is that the formidable processing horsepower in current iPhones and iPads allows Frax to display and manipulate these visual patterns in dizzying detail–far beyond the superficial treatment of, say, a screensaver. “The iPhone was the first mobile device to have the horsepower to do realtime graphics like this, so we saw the opportunity to bring the visual excitement of fractals to a new medium, and in a new style,” says Ben Weiss, who created Frax with UI guru Kai Krause and Tom Beddard (a designer we’ve written about before). “As the hardware has improved, the complexity of the app has grown exponentially, as has its performance.” Frax lets you pan, zoom, and animate fractal art–plus play with elaborate 3-D and lighting effects.

I was afraid of this day.

The day when I would see an iPhone or iPad app that I just could not live without. 😉

If you think fractals are just pretty, remember Fractal Tree Indexing? And TukoDB?

From later in the post:

Frax offers a paid upgrade which unlocks hundreds of visual parameters to play with, as well as access to Frax’s own cloud-based render farm (for outputting your mathematical masterpieces at 50-megapixel resolution).

The top image in this post is also from the original post.

I first saw this in a tweet by IBMResearch.

Semantics and Delivery of Useful Information [Bills Before the U.S. House]

Filed under: Government,Government Data,Law,Semantics — Patrick Durusau @ 2:23 pm

Lars Marius Garshol pointed out in Semantic Web adoption and the users the question of “What do semantic technologies do better than non-semantic technologies?” has yet to be answered.

Tim O’Reilly tweeted about Madison Federal today, a resource that raises the semantic versus non-semantic technology question.

In a nutshell, Madison Federal has all the bills pending before the U.S. House of Representatives online.

If you login with Facebook, you can:

  • Add a bill edit / comment
  • Enter a community suggestion
  • Enter a community comment
  • Subscribe to future edits/comments on a bill

So far, so good.

You can pick any bill but the one I chose as an example is: Postal Executive Accountability Act.

I will quote just a few lines of the bill:

2. Limits on executive pay

    (a) Limitation on compensation Section 1003 of title 39, United States Code, 
         is amended:

         (1) in subsection (a), by striking the last sentence; and
         (2) by adding at the end the following:

             (e)
                  (1) Subject to paragraph (2), an officer or employee of the Postal 
                      Service may not be paid at a rate of basic pay that exceeds 
                      the rate of basic pay for level II of the Executive Schedule 
                      under section 5312 of title 5.

What would be the first thing you want to know?

Hmmm, what about subsection (a) of title 39 of the United States Code since we are striking the last sentence?

39 USC § 1003 – Employment policy [Legal Information Institute], which reads:

(a) Except as provided under chapters 2 and 12 of this title, section 8G of the Inspector General Act of 1978, or other provision of law, the Postal Service shall classify and fix the compensation and benefits of all officers and employees in the Postal Service. It shall be the policy of the Postal Service to maintain compensation and benefits for all officers and employees on a standard of comparability to the compensation and benefits paid for comparable levels of work in the private sector of the economy. No officer or employee shall be paid compensation at a rate in excess of the rate for level I of the Executive Schedule under section 5312 of title 5.

OK, so now we know that (1) is striking:

No officer or employee shall be paid compensation at a rate in excess of the rate for level I of the Executive Schedule under section 5312 of title 5.

Semantics? No, just a hyperlink.

For the added text, we want to know what is meant by:

… rate of basic pay that exceeds the rate of basic pay for level II of the Executive Schedule under section 5312 of title 5.

The Legal Information Institute is already ahead of Congress because their system provides the hyperlink we need: 5312 of title 5.

If you notice something amiss when you follow that link, congratulations! You have discovered your first congressional typo and/or error.

5312 of title 5 defines Schedule I of the Executive Schedule, which includes the Secretary of State, Secretary of the Treasury, Secretary of Defense, Attorney General and others. Base rate for Executive Schedule Level I is $199,700.

On the other hand, 5313 of title 5 defines Schedule II of the Executive Schedule, which includes Department of Agriculture, Deputy Secretary of Agriculture; Department of Defense, Deputy Secretary of Defense, Secretary of the Army, Secretary of the Navy, Secretary of the Air Force, Under Secretary of Defense for Acquisition, Technology and Logistics; Department of Education, Deputy Secretary of Education; Department of Energy, Deputy Secretary of Energy and others. Base rate for Executive Schedule Level II is $178,700.

Assuming someone catches or comments that 5312 should be 5313, top earners at the Postal Service may be about to take a $21,000.00 pay reduction.

We got all that from mechanical hyperlinks, no semantic technology required.

Where you might need semantic technology is when reading 39 USC § 1003 – Employment policy [Legal Information Institute] where it says (in part):

…It shall be the policy of the Postal Service to maintain compensation and benefits for all officers and employees on a standard of comparability to the compensation and benefits paid for comparable levels of work in the private sector of the economy….

Some questions:

Question: What are “comparable levels of work in the private sector of the economy?”

Question: On what basis is work for the Postal Service compared to work in the private economy?

Question: Examples of comparable jobs in the private economy and their compensation?

Question: What policy or guideline documents have been developed by the Postal Service for evaluation of Postal Service vs. work in the private economy?

Question: What studies have been done, by who, using what practices, on comparing compensation for Postal Service work to work in the private economy?

That would be a considerable amount of information with what I suspect would be a large amount of duplication as reports or studies are cited by numerous sources.

Semantic technology would be necessary for the purpose of deduping and navigating such a body of information effectively.

Pick a bill. Where would you put the divide between mechanical hyperlinks and semantic technologies?

PS: You may remember that the House of Representatives had their own “post office” which they ran as a slush fund. The thought of the House holding someone “accountable” is too bizarre for words.

October 20, 2013

Crawl Anywhere

Filed under: Search Engines,Search Interface,Solr,Webcrawler — Patrick Durusau @ 5:59 pm

Crawl Anywhere 4.0.0-release-candidate available

From the Overview:

What is Crawl Anywhere?

Crawl Anywhere allows you to build vertical search engines. Crawl Anywhere includes :   

  • a Web Crawler with a powerful Web user interface
  • a document processing pipeline
  • a Solr indexer
  • a full featured and customizable search application

You can see the diagram of a typical use of all components in this diagram.

Why was Crawl Anywhere created?

Crawl Anywhere was originally developed to index in Apache Solr 5400 web sites (more than 10.000.000 pages) for the Hurisearch search engine: http://www.hurisearch.org/. During this project, various crawlers were evaluated (heritrix, nutch, …) but one key feature was missing : a user friendly web interface to manage Web sites to be crawled with their specific crawl rules. Mainly for this raison, we decided to develop our own Web crawler. Why did we choose the name "Crawl Anywhere" ? This name may appear a little over stated, but crawl any source types (Web, database, CMS, …) is a real objective and Crawl Anywhere was designed in order to easily implement new source connectors.

Can you create a better search corpus for some domain X than Google?

Less noise and trash?

More high quality content?

Cross referencing? (Not more like this but meaningful cross-references.)

There is only one way to find out!

Crawl Anywhere will help you with the technical side of creating a search corpus.

What it won’t help with is developing the strategy to build and maintain such a corpus.

Interested in how you go beyond creating a subject specific list of resources?

A list that leaves a reader to sort though the chaff. Time and time again.

Pointers, suggestions, comments?

PredictionIO Guide

Filed under: Cascading,Hadoop,Machine Learning,Mahout,Scalding — Patrick Durusau @ 4:20 pm

PredictionIO Guide

From the webpage:

PredictionIO is an open source Machine Learning Server. It empowers programmers and data engineers to build smart applications. With PredictionIO, you can add the following features to your apps instantly:

  • predict user behaviors
  • offer personalized video, news, deals, ads and job openings
  • help users to discover interesting events, documents, apps and restaurants
  • provide impressive match-making services
  • and more….

PredictionIO is built on top of solid open source technology. We support Hadoop, Mahout, Cascading and Scalding natively.

PredictionIO looks interesting in general but especially its Item Similarity Engine.

From the Item Similarity: Overview:

People who like this may also like….

This engine tries to suggest N items that are similar to a targeted item. By being ‘similar’, it does not necessarily mean that the two items look alike, nor they share similar attributes. The definition of similarity is independently defined by each algorithm and is usually calculated by a distance function. The built-in algorithms assume that similarity between two items means the likelihood any user would like (or buy, view etc) both of them.

The example that comes to mind is merging all “shoes” from any store and using the resulting price “occurrences” to create a price range and average for each store.

In re EPIC – NSA Telephone Records Surveillance

Filed under: Cybersecurity,NSA,Security — Patrick Durusau @ 3:56 pm

In re EPIC – NSA Telephone Records Surveillance

From the webpage:

“It is simply not possible that every phone record in the possession of a telecommunications firm could be relevant to an authorized investigation. Such an interpretation of Section 1861 would render meaningless the qualifying phrases contained in the provision and eviscerate the purpose of the Act.” – EPIC Mandamus Petition

Factual Background

The Verizon Order

On June 5, 2013, a secret Foreign Intelligence Surveillance Court (“FISC”) order allowing the Federal Bureau of Investigation (“FBI”) and the National Security Agency (“NSA”) to obtain vast amounts of telephone call data of Verizon customers was made public. The order, issued April 25, 2013, does not link this data collection to any specific target or investigation, but instead grants sweeping authority compelling Verizon to produce to the NSA “all call detail records or ‘telephony metadata’ created by Verizon for communications (i) between the United States and abroad; or (ii) wholly within the United States, including local telephone calls.” As a result, the NSA collected the telephone records of millions of Verizon customers, including those who only make calls to other U.S. numbers. Senator Diane Feinstein, Chairwoman of the Senate Intelligence Committee, has confirmed that this FISC Order is part of an ongoing electronic communications surveillance program that has been reauthorized since 2007. EPIC is a Verizon customer, and has been for the entire period the FISC Order has been in effect. Because the FISC Order compels disclosure of “all call detail records,” EPIC’s telephone metadata are subject to the order and have been disclosed to the NSA.

The Electronic Privacy Information Center (EPIC) is seeking to have the U.S. Supreme Court vacate the Verizon order. In legal terms, the Supreme Court is being asked to issue a writ of mandamus, that is an order to the FISC court to vacate its Verizon order and one assumes to no violate U.S. law in the future.

The EPIC effort is one step in a long march to recover the republic.

For topic mapping the loss of rights in the U.S. since 9/11, this site makes a very good starting point.

Visual Sedimentation

Filed under: Data Streams,Graphics,Visualization — Patrick Durusau @ 3:21 pm

Visual Sedimentation

From the webpage:

VisualSedimentation.js is a JavaScript library for visualizing streaming data, inspired by the process of physical sedimentation. Visual Sedimentation is built on top of existing toolkits such as D3.js (to manipulate documents based on data), jQuery (to facilitate HTML and Javascript development) and Box2DWeb (for physical world simulation).

I had trouble with the video but what I saw was very impressive!

From the Visual Sedimentation paper by Samuel Huron, Romain Vuillemot, and Jean-Daniel Fekete:

Abstract:

We introduce Visual Sedimentation, a novel design metaphor for visualizing data streams directly inspired by the physical process of sedimentation. Visualizing data streams (e. g., Tweets, RSS, Emails) is challenging as incoming data arrive at unpredictable rates and have to remain readable. For data streams, clearly expressing chronological order while avoiding clutter, and keeping aging data visible, are important. The metaphor is drawn from the real-world sedimentation processes: objects fall due to gravity, and aggregate into strata over time. Inspired by this metaphor, data is visually depicted as falling objects using a force model to land on a surface, aggregating into strata over time. In this paper, we discuss how this metaphor addresses the specific challenge of smoothing the transition between incoming and aging data. We describe the metaphor’s design space, a toolkit developed to facilitate its implementation, and example applications to a range of case studies. We then explore the generative capabilities of the design space through our toolkit. We finally illustrate creative extensions of the metaphor when applied to real streams of data.

If you are processing data streams, definitely worth a close look!

Say Good-Bye to iTunes: > 400 NLP Videos

Filed under: Linguistics,Natural Language Processing — Patrick Durusau @ 2:59 pm

Chris Callison-Burch’s Videos

Chris tweeted today that he is less than twenty-five videos away from digitizing the entire CLSP video archive.

Currently there are four hundred and twenty-five NLP videos at Chris’ Vimeo page.

Way to go Chris!

Spread the word about this remarkable resource!

October 19, 2013

Data Mining Blogs

Filed under: Data Mining — Patrick Durusau @ 7:36 pm

Data Mining Blogs by Sandro Saitta.

An updated and impressive list of data mining blogs!

I count sixty (60) working blogs.

Might be time to update your RSS feeds.

October 18, 2013

Semantic Web adoption and the users

Filed under: Marketing,Semantic Web — Patrick Durusau @ 6:58 pm

Semantic Web adoption and the users by Lars Marius Garshol.

From the post:

A hot topic at ESWC 2013, and many other places besides, was the issue of Semantic Web adoption, which after a decade and a half is still less than it should be. The thorny question is: what can be done about it? David Karger did a keynote on the subject at ESWC 2013 where he argued that the Semantic Web can help users manage their data. I think he’s right, but that this is only a very narrow area of application. In any case, end users are not the people we should aim for if adoption of Semantic Web technologies is to be the goal.

End users and technology

In a nutshell, end users do not adopt technology, they choose tools. They find an application they think solves their problem, then buy or install that. They want to keep track of their customers, so they buy a CRM tool. What technology the tool is based on is something they very rarely care about, and rightly so, as it’s the features of the tool itself that generally matters to them.

Thinking about comparable cases may help make this point more clearly. How did relational databases succeed? Not by appealing to end users. When you use an RDBMS-based application today, are users aware what’s under the hood? Very rarely. Similarly with XML. At heart it’s a very simple technology, but even so it was not end users who bought into it, but rather developers, consultants, software vendors, and architects.

If the Semantic Web technologies ever succeed, it will be by appealing to the same groups. Unfortunately, the community is doing a poor job of that now.

Lars describes the developer community as being a hard sell for technology, in part because it is inherently conservative.

But what is the one thing that both users and developers have in common?

Would you say that both users and developers are lazy?

Semantic technologies of all types, take more effort, more thinking, than the alternatives. Even rote tagging takes some effort. Useful tagging/annotation takes a good bit more.

Is adoption of semantic technologies or should I say non-adoption of semantic technologies, another example of Kahneman’s System 1?

You may recall the categories are:

  • System 1: Fast, automatic, frequent, emotional, stereotypic, subconscious
  • System 2: Slow, effortful, infrequent, logical, calculating, conscious

In the book, Thinking, Fast and Slow, Kahneman makes a compelling case that without a lot of effort, we all tend to lapse into System 1.

If that is the case, Lars’s statement:

[Users] find an application they think solves their problem, then buy or install that.

could be pointing us in the right direction.

Users aren’t interested in building a solution (all semantic technologies) but are interested in buying a solution.

By the same token:

Developers aren’t interested in understanding and documenting semantics.

All of which makes me curious:

Why do semantic technology advocates resist producing semantic products of interest to users or developers?

Or is producing a semantic technology easier than producing a semantic product?

Home Brew Big Data

Filed under: BigData — Patrick Durusau @ 6:56 pm

You may not be interested in the signals captured by radio telescopes but there are sources of radio signals closer to home.

Take for example How to Make a $19 Police Scanner.

That page is pitched to Windows users but equivalent software for Linux is available.

There are traditional police scanners but to make it a big data project, why not synchronize time with another enthusiast and capture the same signals?

Reminds me of cell towers and signal strength to locate cell phones.

And depending on how sophisticated you want to make your signal capture setup, you may harvest enough radio traffic to discover patterns in your data.

Google has sex offender maps.

Maybe you can sponsor a police location map. In real time.

And match up patrol cars with police officers, their arrest stats, etc.

Just to make it interesting.

Exploring Neo4j Datasets

Filed under: Graphs,Neo4j — Patrick Durusau @ 5:55 pm

Neo4j: Exploring new data sets with help from Neo4j browser by Mark Needham.

From the post:

One of the things that I’ve found difficult when looking at a new Neo4j database is working out the structure of the data it contains.

I’m used to relational databases where you can easily get a list of the table and the foreign keys that allow you to join them to each other.

This has traditionally been difficult when using Neo4j but with the release of the Neo4j browser we can now easily get this type of overview by clicking on the Neo4j icon at the top left of the browser.

We’ll see something similar to the image on the left which shows the structure of my football graph and we can now discover parts of the graph by clicking on the various labels, properties or relationships.

See Mark’s post to follow along.

Oh, you don’t have the latest release?

Best correct that over sight before reading Mark’s post!

Updated conclusions about the graph database benchmark…

Filed under: Benchmarks,Graphs,Neo4j — Patrick Durusau @ 4:44 pm

Updated conclusions about the graph database benchmark – Neo4j can perform much better by Alex Popescu.

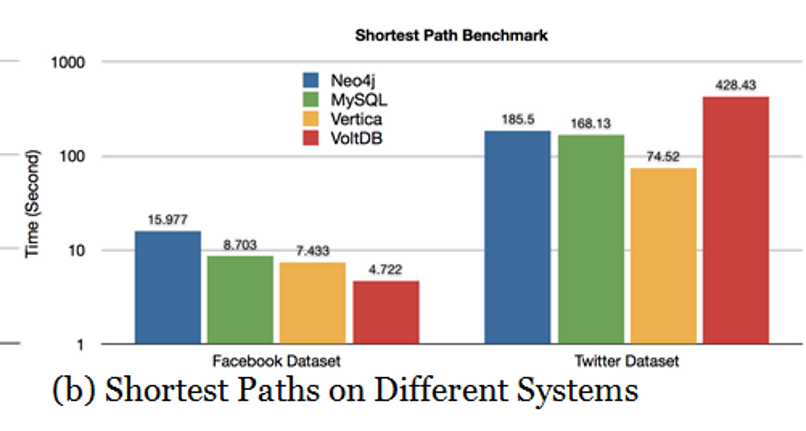
You may recall in Benchmarking Graph Databases I reported on a comparison of Neo4j against three relational databases, MySQL, Vertica and VoltDB.

Alex has listed resources relevant to the response from the original testers:

Our conclusions from this are that, like any of the complex systems we tested, properly tuning Neo4j can be tricky and getting optimal performance may require some experimentation with parameters. Whether a user of Neo4j can expect to see runtimes on graphs like this measured in milliseconds or seconds depends on workload characteristics (warm / cold cache) and whether setup steps can be amortized across many queries or not.

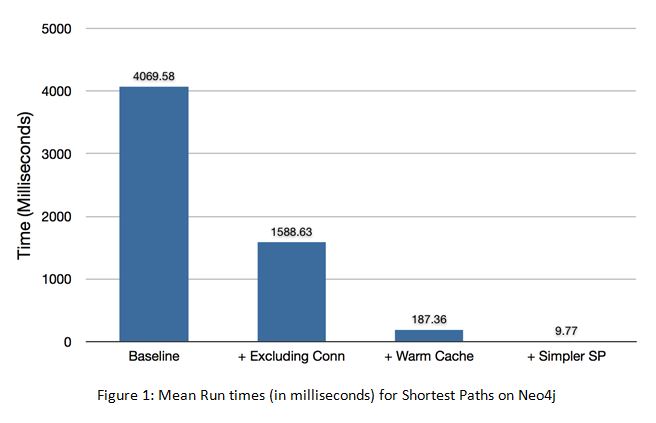
The response, Benchmarking Graph Databases – Updates, shows that Neo4j on shortest path outperforms MySQL, Vertica and VoltDB.

But scores on shortest path don’t appear for MySQL, Vertica and VoltDB on shortest path in the “Updates” post.

Let me help you with that.

Here is the original comparison:

Original comparison on shortest path

Here is Neo4j shortest path after reading the docs and suggestions from Neo4j tech support:

Neo4j shortest path

First graph has time in seconds, second graph has time in milliseconds.

Set up correctly, measure milliseconds on shortest path for Neo4j. SQL solutions, well, the numbers speak for themselves.

The moral here is to read software documentation and contact tech support before performing and publishing benchmarks.

A Case Study on Legal Case Annotation

Filed under: Annotation,Law,Law - Sources — Patrick Durusau @ 3:48 pm

A Case Study on Legal Case Annotation by Adam Wyner, Wim Peters, and Daniel Katz.

Abstract:

The paper reports the outcomes of a study with law school students to annotate a corpus of legal cases for a variety of annotation types, e.g. citation indices, legal facts, rationale, judgement, cause of action, and others. An online tool is used by a group of annotators that results in an annotated corpus. Differences amongst the annotations are curated, producing a gold standard corpus of annotated texts. The annotations can be extracted with semantic searches of complex queries. There would be many such uses for the development and analysis of such a corpus for both legal education and legal research.

Bibtex
@INPROCEEDINGS{WynerPetersKatzJURIX2013,
author = {Adam Wyner and Peters, Wim, and Daniel Katz},
title = {A Case Study on Legal Case Annotation},
booktitle = {Proceedings of 26th International Conference on Legal Knowledge and Information Systems (JURIX 2013)},
year = {2013},
pages = {??-??},
address = {Amsterdam},
publisher = {IOS Press}
}

The methodology and results of this study will be released as open source resources.

A gold standard for annotation of legal texts will create the potential for automated tools to assist lawyers, judges and possibly even lay people.

Deeply interested to see where this project goes next.

Enhancing Linguistic Search with…

Filed under: Linguistics,Ngram Viewer — Patrick Durusau @ 3:27 pm

Enhancing Linguistic Search with the Google Books Ngram Viewer by Slav Petrov and Dipanjan Das.

From the post:


With our interns Jason Mann, Lu Yang, and David Zhang, we’ve added three new features. The first is wildcards: by putting an asterisk as a placeholder in your query, you can retrieve the ten most popular replacement. For instance, what noun most often follows “Queen” in English fiction? The answer is “Elizabeth”:

Another feature we’ve added is the ability to search for inflections: different grammatical forms of the same word. (Inflections of the verb “eat” include “ate”, “eating”, “eats”, and “eaten”.) Here, we can see that the phrase “changing roles” has recently surged in popularity in English fiction, besting “change roles”, which earlier dethroned “changed roles”:

Finally, we’ve implemented the most common feature request from our users: the ability to search for multiple capitalization styles simultaneously. Until now, searching for common capitalizations of “Mother Earth” required using a plus sign to combine ngrams (e.g., “Mother Earth + mother Earth + mother earth”), but now the case-insensitive checkbox makes it easier:

The ngram data sets are available for download.

As of the date of this post, the data sets go up to 5-grams in multiple languages.

Be mindful of semantic drift, the changing of the meaning of words, over centuries or decades. Even across social, economic strata and work domains at the same time.

Introduction to Data Science at Columbia University

Filed under: Computer Science,Data Science — Patrick Durusau @ 3:01 pm

Introduction to Data Science at Columbia University by Dr. Rachel Schutt.

The link points to a blog for the course. Includes entries for the same class last year.

Search for “INTRODUCTION TO DATA SCIENCE VERSION 2.0” and that should put you out at the first class for Fall 2013.

Personally I would read the entries for 2012 as well.

Hard to know when a chance remark from a student will provoke new ideas from other students or even professors.

That is one the things I like the most about teaching, being challenged by insights and views that hadn’t occurred to me.

Not that I always agree with them but it is a nice break from talking to myself. 😉

I first saw this at: Columbia Intro to Data Science 2.0.

Graph Modeling Do’s and Don’ts

Filed under: Graphs,Neo4j — Patrick Durusau @ 2:48 pm

Graph Modeling Do’s and Don’ts by Mark Needham.

Mark Needham credits Ian Robinson [Corrected from “Ian Anderson,” sorry.] with these slides.

Some ninety-six (96) slides in all, nearly all of which you will find useful for graph modeling.

Mark posted these in, let us say, a non-PDF format and I have converted them to PDF for your viewing pleasure.

😉

Enjoy!

Are Graph Databases Ready for Bioinformatics?

Filed under: Bioinformatics,Graph Databases,Graphs — Patrick Durusau @ 1:29 pm

Are Graph Databases Ready for Bioinformatics? by Christian Theil Have and Lars Juhl Jensen.

From the editorial:

Graphs are ubiquitous in bioinformatics and frequently consist of too many nodes and edges to represent in RAM. These graphs are thus stored in databases to allow for efficient queries using declarative query languages such as SQL. Traditional relational databases (e.g. MySQL and PostgreSQL) have long been used for this purpose and are based on decades of research into query optimization. Recently, NoSQL databases have caught a lot of attention due to their advantages in scalability. The term NoSQL is used to refer to schemaless databases such as key/value stores (e.g. Apache Cassandra), document stores (e.g. MongoDB) and graph databases (e.g. AllegroGraph, Neo4J, OpenLink Virtuoso), which do not fit within the traditional relational paradigm. Most NoSQL databases do not have a declarative query language. The widely used Neo4J graph database is an exception. Its query language Cypher is designed for expressing graph queries, but is still evolving.

Graph databases have so far seen only limited use within bioinformatics [Schriml et al., 2013]. To illustrate the pros and cons of using a graph database (exemplified by Neo4J v1.8.1) instead of a relational database (PostgreSQL v9.1) we imported into both the human interaction network from STRING v9.05 [Franceschini et al., 2013], which is an approximately scale-free network with 20,140 proteins and 2.2 million interactions. As all graph databases, Neo4J stores edges as direct pointers between nodes, which can thus be traversed in constant time. Because Neo4j uses the property graph model, nodes and edges can have properties associated with them; we use this for storing the protein names and the confidence scores associated with the interactions. In PostgreSQL, we stored the graph as an indexed table of node pairs, which can be traversed with either logarithmic or constant lookup complexity depending on the type of index used. On these databases we benchmarked the speed of Cypher and SQL queries for solving three bioinformatics graph processing problems: finding immediate neighbors and their interactions, finding the best scoring path between two proteins, and finding the shortest path between them. We have selected these three tasks because they illustrate well the strengths and weaknesses of graph databases compared to traditional relational databases.

Encouraging but also makes the case for improvements in graph database software.

…A new open Scientific Data journal

Filed under: Data,Dataset,Science — Patrick Durusau @ 12:40 pm

Publishing one’s research data : A new open Scientific Data journal

From the post:

A new Journal called ‘Scientific Data‘ to be launched by Nature in May 2014 has made a call for submissions. What makes this publication unique is that it is open-access, online-only publication for descriptions of scientifically valuable datasets, which aims to foster data sharing and reuse, and ultimately to accelerate the pace of scientific discovery.

Sample publications, 1 and 2.

From the journal homepage:

Launching in May 2014 and open now for submissions, Scientific Data is a new open-access, online-only publication for descriptions of scientifically valuable datasets, initially focusing on the life, biomedical and environmental science communities

Scientific Data exists to help you publish, discover and reuse research data and is built around six key principles:

  • Credit: Credit, through a citable publication, for depositing and sharing your data
  • Reuse: Complete, curated and standardized descriptions enable the reuse of your data
  • Quality: Rigorous community-based peer review
  • Discovery: Find datasets relevant to your research
  • Open: Promotes and endorses open science principles for the use, reuse and distribution of your data, and is available to all through a Creative Commons license
  • Service: In-house curation, rapid peer-review and publication of your data descriptions

Possibly an important source of scientific data in the not so distant future.

October 17, 2013

Busting the King’s Gambit [Scaling Merging]

Filed under: Merging,Topic Maps — Patrick Durusau @ 6:34 pm

Rajlich: Busting the King’s Gambit, this time for sure by Frederic Friedel.

From the post (an interview with Vasik Rajlich):

Fifty years ago Bobby Fischer published a famous article, “A Bust to the King’s Gambit”, in which he claimed to have refuted this formerly popular opening. Now chess programmer IM Vasik Rajlich has actually done it, with technical means. 3000 processor cores, running for over four months, exhaustively analysed all lines that follow after 1.e4 e5 2.f4 exf4 and came to some extraordinary conclusions.

Vasik Rajlich: Okay, here’s what we have been doing. You know that Lukas Cimiotti has set up a cluster of computers, currently around 300 cores, which has been used by World Champions and World Champion candidates to prepare for their matches. It is arguably the most powerful entity to play chess, ever, anywhere. Well, that was until we hooked it up to a massively parallel cluster of IBM POWER 7 Servers provided by David Slate, senior manager of IBM’s Semantic Analysis and Integration department – 2,880 cores at 4.25 GHz, 16 terabytes of RAM, very similar to the hardware used by IBM’s Watson in winning the TV show “Jeopardy”. The IBM servers ran a port of the latest version of Rybka, and computation was split across the two clusters, with the Cimiotti cluster distributing the search to the IBM hardware.

We developed an algorithm which attempts to classify chess positions into wins, draws and losses. Using this algorithm, we have just finished classifying the King’s Gambit. In other words, the King’s Gambit is now solved.

Whoa, that’s quite a lot to digest. First of all what exactly do you mean when you say that the King’s Gambit is “solved”?

It’s solved in the sense that we know the outcome, just as we know the outcome for most five and six piece endings. Except that here we are dealing with a single starting position…

… which is?

1.e4 e5 2.f4 exf4. We now know the exact outcome of this position, assuming perfect play, of course. I know your next question, so I am going to pre-empt it: there is only one move that draws for White, and that is, somewhat surprisingly, 3.Be2. Every other move loses by force.

And what does that have to do with topic maps? Read a bit further:

Actually much more than “gazillions” – something in the order of 10^100, which is vastly more than the number of elementary particles in the universe. Obviously we could not go through all of them – nobody and nothing will ever be able to do that. But: you do not have to check every continuation. It’s similar to Alpha-Beta, which looks at a very small subset of possible moves but delivers a result that is identical to what you would get if you looked at every single move, down to the specified depth.

But Alpha-Beta reduces the search to about the square root of the total number of moves. The square root of 10^100, however…

Yes, I know. But think about it: you do not need to search every variation to mate. We only need to search a tiny fraction of the overall space. Whenever Rybka evaluates a position with a score of +/– 5.12 we don’t need to search any further, we have our proof that in the continuation there is going to be a win or loss, and there is a forced mate somewhere deep down in the tree. We tested a random sampling of positions of varying levels of difficulty that were evaluated at above 5.12, and we never saw a solution fail. So it is safe to use this assumption generally in the search.

I read that as meaning that we don’t have to search the entire merging space for any set of proxies/topics.

I suspect it will be domain specific but once certain properties or values are encountered, no merging is going to occur, ever.

They can be safely ignored for all future iterations of merging.

Which will quickly down the merging space that has to be examined.

Another way to scale is to reduce the problem size. Yes?

Introduction to Bayesian Networks & BayesiaLab

Filed under: Bayesian Data Analysis,Bayesian Models — Patrick Durusau @ 6:20 pm

Introduction to Bayesian Networks & BayesiaLab by Stefan Conrady and Dr. Lionel Jouffe.

From the webpage:

With Professor Judea Pearl receiving the prestigious 2011 A.M. Turing Award, Bayesian networks have presumably received more public recognition than ever before. Judea Pearl’s achievement of establishing Bayesian networks as a new paradigm is fittingly summarized by Stuart Russell:

“[Judea Pearl] is credited with the invention of Bayesian networks, a mathematical formalism for defining complex probability models, as well as the principal algorithms used for inference in these models. This work not only revolutionized the field of artificial intelligence but also became an important tool for many other branches of engineering and the natural sciences. He later created a mathematical framework for causal inference that has had significant impact in the social sciences.”

While their theoretical properties made Bayesian networks immediately attractive for academic research, especially with regard to the study of causality, the arrival of practically feasible machine learning algorithms has allowed Bayesian networks to grow beyond its origin in the field of computer science. Since the first release of the BayesiaLab software package in 2001, Bayesian networks have finally become accessible to a wide range of scientists and analysts for use in many other disciplines.

In this introductory paper, we present Bayesian networks (the paradigm) and BayesiaLab (the software tool), from the perspective of the applied researcher.

The webpage gives an overview of the white paper. Or you can jump directly to the paper (PDF).

With the emphasis on machine processing, there will be people going through the motions of data processing with a black box and data dumps going into it.

And there will be people who understand the box but not the data flowing into it.

Finally there will be people using cutting edge techniques who understand the box and the data flowing into it.

Which group do you think will have the better results?

Predictive Analytics 101

Filed under: Analytics,Business Intelligence,Predictive Analytics — Patrick Durusau @ 6:05 pm

Predictive Analytics 101 by Ravi Kalakota.

From the post:

Insight, not hindsight is the essence of predictive analytics. How organizations instrument, capture, create and use data is fundamentally changing the dynamics of work, life and leisure.

I strongly believe that we are on the cusp of a multi-year analytics revolution that will transform everything.

Using analytics to compete and innovate is a multi-dimensional issue. It ranges from simple (reporting) to complex (prediction).

Reporting on what is happening in your business right now is the first step to making smart business decisions. This is the core of KPI scorecards or business intelligence (BI). The next level of analytics maturity takes this a step further. Can you understand what is taking place (BI) and also anticipate what is about to take place (predictive analytics).

By automatically delivering relevant insights to end-users, managers and even applications, predictive decision solutions aims to reduces the need of business users to understand the ‘how’ and focus on the ‘why.’ The end goal of predictive analytics = [Better outcomes, smarter decisions, actionable insights, relevant information].

How you execute this varies by industry and information supply chain (Raw Data -> Aggregated Data -> Contextual Intelligence -> Analytical Insights (reporting vs. prediction) -> Decisions (Human or Automated Downstream Actions)).

There are four types of data analysis:

    • Simple summation and statistics
    • Predictive (forecasting),
    • Descriptive (business intelligence and data mining) and
    • Prescriptive (optimization and simulation)

Predictive analytics leverages four core techniques to turn data into valuable, actionable information:

  1. Predictive modeling
  2. Decision Analysis and Optimization
  3. Transaction Profiling
  4. Predictive Search

This post is a very good introduction to predictive analytics.

You may have to do some hand holding to get executives through it but they will be better off for it.

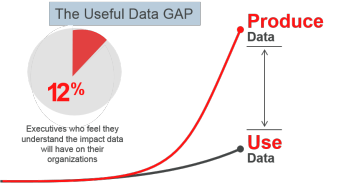
When you need support for more training of executives, use this graphic from Ravi’s post:

useful data gap

That startled even me. 😉

GraphConnect SF 2013 Videos!

Filed under: Graphs,Neo4j — Patrick Durusau @ 5:50 pm

GraphConnect SF 2013 Videos!

By title:

By author:

Getting Started with InfiniteGraph

Filed under: Graphs,InfiniteGraph — Patrick Durusau @ 4:31 pm

Getting Started with InfiniteGraph

From the post:

Applications and devices are generating a flood of data that is increasingly dense, highly interconnected and generally unstructured. Social Media is an obvious example where massive amounts of complex data, such as videos, photos and voice recordings are created daily, but there are many other domains where this applies. Markets such as Healthcare, Security, Telecom and Finance are also facing the pain of managing complex, interconnected and real-time information to stay competitive and maintain performance, security, business intelligence and ROI opportunities. .

This type of data of highly-connected entities, some are referring to as the future “Internet of Things”, is not easily managed using a traditional relational databases; emerging technologies and especially graph databases are rising to address these natural graph problems. Using an enterprise-ready, distributed graph database that is complementary to existing architectures, such as InfiniteGraph™, enables organizations to easily store, manage and search the connections and relationships within data and perform rapid analysis in real-time. InfiniteGraph is a distributed, scalable, high-performance graph database that supports developers and companies seeking to identify and utilize the relationships and connections in massive data sets. InfiniteGraph reduces the time needed to discover these connections from days using standard SQL technologies to a matter of seconds.

Given the explosion of data all around us and the increasing need for solutions that can discover and extract value from the relationships within that data, we have developed this comprehensive Software Reviewer’s Guide to help you get started with InfiniteGraph 3.1.

InfiniteGraph 3.1 Software Reviewer’s Guide

This guide takes you step by step from installing InfiniteGraph to navigating your very own graph.

You can download InfiniteGraph 3.1 for free at http://www.objectivity.com/downloads/

The guide is a bit short (sixteen (16) pages) but it should get you started.

I need to install RHEL 4 or 5 64 Bit on a VM before I can try the guide.

I may as well setup a VM for Windows 7 at the same time. So I can copy-n-paste to and from my main system (Ubuntu).

Open Discovery Initiative Recommended Practice [Comments due 11-18-2013]

Filed under: Discovery Informatics,Library,NISO,Standards — Patrick Durusau @ 4:20 pm

ODI Recommended Practice (NISO RP-19-201x)

From the Open Discovery Initiative (NISO) webpage:

The Open Discovery Initiative (ODI) aims at defining standards and/or best practices for the new generation of library discovery services that are based on indexed search. These discovery services are primarily based upon indexes derived from journals, ebooks and other electronic information of a scholarly nature. The content comes from a range of information providers and products–commercial, open access, institutional, etc. Given the growing interest and activity in the interactions between information providers and discovery services, this group is interested in establishing a more standard set of practices for the ways that content is represented in discovery services and for the interactions between the creators of these services and the information providers whose resources they represent.

If you are interested in the discovery of information, as a publisher, consumer of information, library or otherwise, please take the time to read and comment on this recommended practice.

Spend some time with the In Scope and Out of Scope sections.

So that your comments reflect what the recommendation intended to cover and not what you would prefer that it covered. (That’s advice I need to heed as well.)

Neo4j 2.0.0-M06 – Introducing Neo4j’s Browser

Filed under: Cypher,Graphs,Neo4j — Patrick Durusau @ 3:25 pm

Neo4j 2.0.0-M06 – Introducing Neo4j’s Browser by Andreas Kollegger.

From the post:

Type in a Cypher query, hit , then watch a graph visualization unfold. Want some data? Switch to the table view and download as CSV. Neo4j’s new Browser interface is a fluid developer experience, with iterative query authoring and graph visualization.

Available today in Neo4j 2.0.0 Milestone 6, download now to try out this shiny new user interface.

Like the man said: Download now! 😉

Andreas also suggests:

Ask questions on Stack Overflow.

Discuss ideas on our Google Group

Enjoy!

cudaMap:…

Filed under: Bioinformatics,CUDA,Genomics,GPU,NVIDIA,Topic Map Software,Topic Maps — Patrick Durusau @ 3:16 pm

cudaMap: a GPU accelerated program for gene expression connectivity mapping by Darragh G McArt, Peter Bankhead, Philip D Dunne, Manuel Salto-Tellez, Peter Hamilton, Shu-Dong Zhang.

Abstract:

BACKGROUND: Modern cancer research often involves large datasets and the use of sophisticated statistical techniques. Together these add a heavy computational load to the analysis, which is often coupled with issues surrounding data accessibility. Connectivity mapping is an advanced bioinformatic and computational technique dedicated to therapeutics discovery and drug re-purposing around differential gene expression analysis. On a normal desktop PC, it is common for the connectivity mapping task with a single gene signature to take > 2h to complete using sscMap, a popular Java application that runs on standard CPUs (Central Processing Units). Here, we describe new software, cudaMap, which has been implemented using CUDA C/C++ to harness the computational power of NVIDIA GPUs (Graphics Processing Units) to greatly reduce processing times for connectivity mapping.

RESULTS: cudaMap can identify candidate therapeutics from the same signature in just over thirty seconds when using an NVIDIA Tesla C2050 GPU. Results from the analysis of multiple gene signatures, which would previously have taken several days, can now be obtained in as little as 10 minutes, greatly facilitating candidate therapeutics discovery with high throughput. We are able to demonstrate dramatic speed differentials between GPU assisted performance and CPU executions as the computational load increases for high accuracy evaluation of statistical significance.

CONCLUSION: Emerging ‘omics’ technologies are constantly increasing the volume of data and information to be processed in all areas of biomedical research. Embracing the multicore functionality of GPUs represents a major avenue of local accelerated computing. cudaMap will make a strong contribution in the discovery of candidate therapeutics by enabling speedy execution of heavy duty connectivity mapping tasks, which are increasingly required in modern cancer research. cudaMap is open source and can be freely downloaded from http://purl.oclc.org/NET/cudaMap.

Or to put that in lay terms, the goal is to establish the connections between human diseases, genes that underlie them and drugs that treat them.

Going from several days to ten (10) minutes is quite a gain in performance.

This is processing of experimental data but is it a window into techniques for scaling topic maps?

I first saw this in a tweet by Stefano Bertolo.

Knowledge Management for the Federal Government

Filed under: Government,Knowledge Management,Silos — Patrick Durusau @ 2:38 pm

Knowledge Management for the Federal Government (FCW – Federal Computer Week)

From the post:

Given the fast pace of today’s missions, it’s more important than ever to be able to find critical information easily when you need it. Explore the challenges of information sharing and how Google is helping increase knowledge management capabilities across the federal government.

Interesting enough title for me to download the PDF file.

Which reads (in part):

Executive Summary

Given the fast pace of today’s government missions, it’s more important than ever for employees to be able to find critical information easily when they need it. Today, huge amounts of data are stored in hard-to-access, decentralized systems with different legacy architectures, search engines and security restrictions. Searching across of all these systems is time-consuming. In fact, a study conducted by MeriTalk, DLT Solutions and Google found that 87% of federal employees spend about one and a half hours each day searching internal databases for information. With mission success on the line, overcoming these inefficiencies is a top priority.

This white paper summarizes the challenges of information sharing and explains the advantages that the Google Search Appliance (GSA) can offer to increase knowledge management capabilities across the federal government. It also shares real-life examples of how government agencies are using the GSA to break down information silos and provide users access to exactly the information they need, at the moment they need to know it.

The Google Search Appliance:

  • Bridges new and legacy architectures to deliver a one-stop shop for searches across all systems
  • Ensures the most complete and up-to-date information is available anywhere, any time, on any web-enabled device – regardless of location, bandwidth, access device or platform
  • Moves at the speed of the mission with intuitive, personalized and dynamic search technology
  • Assures complete mission knowledge with 24/7 automatic scaling, crawling and tagging that continuously reveals hidden data associations and missing pieces
  • Breaks down barriers to stove-piped systems and legacy data
  • Enriches gaps in metadata to make searches on legacy data as fast and effective as with new data
  • Is proven, simple to install and easy to use

Well….., except that the “white paper” (2 pages) never says how it will integrate across silos.

Searching across silos is a form of “integration,” an example of which is searching with Google for “Virgin Mary” (sans the quotes):

A large search result with much variety.

Imagine the results if you were searching based on a Westernized mis-spelling of an Arabic name.

I tried to find more details on the Google Search Appliance but came out at DLT Solutions.

Didn’t find any details about the Google Search Appliance that would support the claims in the white paper.

Maybe you will have better luck.

« Newer PostsOlder Posts »

Powered by WordPress