Another Word For It Patrick Durusau on Topic Maps and Semantic Diversity

September 24, 2015

Guesstimating the Future

Filed under: Cypher,Graphs,Neo4j — Patrick Durusau @ 7:07 pm

I ran across some introductory slides on Neo4j with the line:

Forrester estimates that over 25% of enterprises will be using graph databases by 2017.

Well, Forrester also predicted that tablet sales would over take laptops sales in 2015: Forrester: Tablet Sales Will Eclipse Laptop Sales by 2015.

You might want to check that prediction against: Laptop sales ‘stronger than ever’ versus tablets – PCR Retail Advisory Board.

The adage “It is difficult to make predictions, especially about the future.,” remains appropriate.

Neo4j doesn’t need lemming-like behavior among consumers of technology to make a case for itself.

Compare Neo4j and its query language, Cypher, to your use cases and I think you will agree.

September 15, 2015

Graphs in the world: Modeling systems as networks

Filed under: Graphs,Modeling — Patrick Durusau @ 7:39 pm

Graphs in the world: Modeling systems as networks by Russel Jurney.

From the post:

Networks of all kinds drive the modern world. You can build a network from nearly any kind of data set, which is probably why network structures characterize some aspects of most phenomenon. And yet, many people can’t see the networks underlying different systems. In this post, we’re going to survey a series of networks that model different systems in order to understand different ways networks help us understand the world around us.

We’ll explore how to see, extract, and create value with networks. We’ll look at four examples where I used networks to model different phenomenon, starting with startup ecosystems and ending in network-driven marketing.

Loaded with successful graph modeling stories Russel’s post will make you anxious to find a data set to model as a graph.

Which is a good thing.

Combining two inboxes (Russel’s and his brother’s) works because you can presume that identical email addresses belong to the same user. But what about different email addresses that belong to the same user?

For data points that will become nodes in your graph, what “properties” do you see in them that make them separate nodes? Have you captured those properties on those nodes? Ditto for relationships that will become arcs in your graph.

How easy is it for someone other than yourself to combine a graph you make with a graph made by a third person?

Data, whether represented as a graph or not, is nearly always “transparent” to its creator. Beyond modeling, the question for graphs is have you enabled transparency for others?

I first saw this in a tweet by Kirk Borne.

September 3, 2015

Scheduling Tasks and Drawing Graphs…

Filed under: Graphs,Visualization — Patrick Durusau @ 8:47 pm

Scheduling Tasks and Drawing Graphs — The Coffman-Graham Algorithm by Borislav Iordanov.

From the post:

When an algorithm developed for one problem domain applies almost verbatim to another, completely unrelated domain, that is the type of insight, beauty and depth that makes computer science a science on its own, and not a branch of something else, namely mathematics, like many professionals educated in the field mistakenly believe. For example, one of the common algorithmic problems during the 60s was the scheduling of tasks on multiprocessor machines. The problem is, you are given a large set of tasks, some of which depend on others, that have to be scheduled for processing on N number of processors in such a way as to maximize processor use. A well-known algorithm for this problem is the Coffman-Graham algorithm. It assumes that there are no circular dependencies between the tasks, as is usually the case when it comes to real world tasks, except in catch 22 situations at some bureaucracies run amok! To do that, the tasks and their dependencies are modeled as a DAG (a directed acyclic graph). In mathematics, this is also known as a partial order: if a tasks T1 depends on T2, we say that T2 preceeds T1, and we write T2 < T1. The ordering is called partial because not all tasks are related in this precedence relation, some are simply independent of each other and can be safely carried out in parallel.

The post is a 5 minute read and ends beautifully. I promise.

September 1, 2015

Sturctr Restructuring

Filed under: Graphs,Neo4j,structr — Patrick Durusau @ 7:46 pm

Over several recent tweets I have seen that Structr is restructuring its websites to better separate structr.com (commercial) from structr.org (open source) communities.

The upcoming structr release is 2.0 and is set for just before @GraphConnect (Oct. 21, 2015). Another tweet says there are lots of new features, full-text file and URL indexing, SSH/SCP support, a new Files UI etc.)

That makes October seem further away that it was just moments ago. 😉

August 30, 2015

Network motif discovery: A GPU approach [subgraph isomorphism and topics]

Filed under: GPU,Graphs,Networks — Patrick Durusau @ 4:13 pm

Network motif discovery: A GPU approach by Wenqing Lin ; Xiaokui Xiao ; Xing Xie ; Xiao-Li Li.

Abstract:

The identification of network motifs has important applications in numerous domains, such as pattern detection in biological networks and graph analysis in digital circuits. However, mining network motifs is computationally challenging, as it requires enumerating subgraphs from a real-life graph, and computing the frequency of each subgraph in a large number of random graphs. In particular, existing solutions often require days to derive network motifs from biological networks with only a few thousand vertices. To address this problem, this paper presents a novel study on network motif discovery using Graphical Processing Units (GPUs). The basic idea is to employ GPUs to parallelize a large number of subgraph matching tasks in computing subgraph frequencies from random graphs, so as to reduce the overall computation time of network motif discovery. We explore the design space of GPU-based subgraph matching algorithms, with careful analysis of several crucial factors that affect the performance of GPU programs. Based on our analysis, we develop a GPU-based solution that (i) considerably differs from existing CPU-based methods, and (ii) exploits the strengths of GPUs in terms of parallelism while mitigating their limitations in terms of the computation power per GPU core. With extensive experiments on a variety of biological networks, we show that our solution is up to two orders of magnitude faster than the best CPU-based approach, and is around 20 times more cost-effective than the latter, when taking into account the monetary costs of the CPU and GPUs used.

For those of you who need to dodge the paywall: Network motif discovery: A GPU approach

From the introduction (topic map comments interspersed):

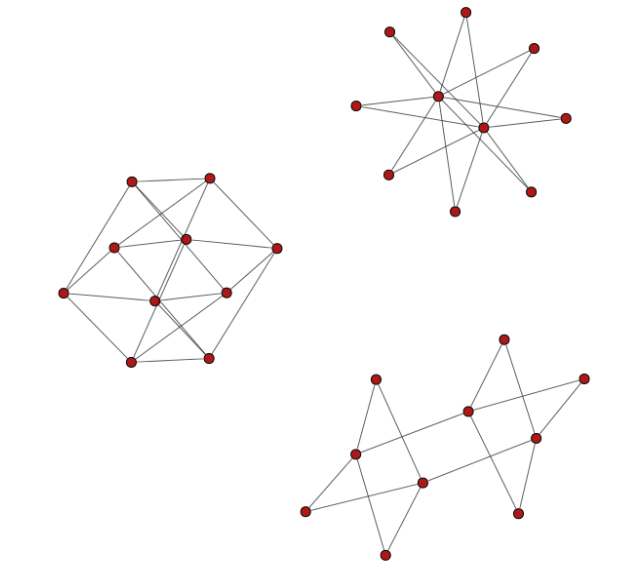
Given a graph $$G$$, a network motif in $$G$$ is a subgraph $$g$$ of $$G$$, such that $$g$$ appears much more frequently in $$G$$ than in random graphs whose degree distributions are similar to that of $$G$$ [1]. The identification of network motifs finds important applications in numerous domains. For example, network motifs are used (i) in system biology to predict protein interactions in biological networks and discover functional sub-units [2], (ii) in electronic engineering to understand the characteristics of circuits [3], and (iii) in brain science to study the functionalities of brain networks [4].

Unlike a topic map considered as graph $$G$$, the network motif problem is to discover subgraphs of $$G$$. In a topic map, the subgraph constituting a topic and its defined isomophism with other topics, is declarable.

…Roughly speaking, all existing techniques adopt a common two-phase framework as follows:

Subgraph Enumeration: Given a graph $$G$$ and a parameter $$k$$, enumerate the subgraphs $$g$$ of $$G$$ with $$k$$ vertices each;

Frequency Estimation:

Rather than enumerating subgraph $$g$$ of $$G$$ (a topic map), we need only collect those subgraphs for the isomorphism test.

…To compute the frequency of $$g$$ in a random graph $$G’$$, however, we need to derive the number of subgraphs of $$G$$ that are isomorphic to $$g$$ – this requires a large number of subgraph isomorphism tests [14], which are known to be computationally expensive.

Footnote 14 is a reference to: Practical graph isomorphism, II by Brendan D. McKay, Adolfo Piperno.

See also: nauty and Traces by Brendan McKay and Adolfo Piperno.

nauty and Traces are programs for computing automorphism groups of graphs and digraphs [*]. They can also produce a canonical label. They are written in a portable subset of C, and run on a considerable number of different systems.

This is where topic map subgraph $$g$$ isomorphism issue intersects with the more general subgraph isomorphism case.

Any topic can have properties (nee internal occurrences) in addition to those thought to make it “isomorphic” to another topic. Or play roles in associations that are not played by other topics representing the same subject.

Motivated by the deficiency of existing work, we present an in-depth study on efficient solutions for network motif discovery. Instead of focusing on the efficiency of individual subgraph isomorphism tests, we propose to utilize Graphics Processing Units (GPUs) to parallelize a large number of isomorphism tests, in order to reduce the computation time of the frequency estimation phase. This idea is intuitive, and yet, it presents a research challenge since there is no existing algorithm for testing subgraph isomorphisms on GPUs. Furthermore, as shown in Section III, existing CPU-based algorithms for subgraph isomorphism tests cannot be translated into efficient solutions on GPUs, as the characteristics of GPUs make them inherently unsuitable for several key procedures used in CPU-based algorithms.

The punch line is that the authors present a solution that:

…is up to two orders of magnitude faster than the best CPU-based approach, and is around 20 times more cost-effective than the latter, when taking into account the monetary costs of the CPU and GPUs used.

Since topic isomophism is defined as opposed to discovered, this looks like a fruitful avenue to explore for topic map engine performance.

August 22, 2015

TinkerPop3 Promo in One Paragraph

Filed under: Graphs,TinkerPop — Patrick Durusau @ 7:54 pm

Marko A. Rodriguez tweeted https://news.ycombinator.com/item?id=10104282 as a “single paragraph” explanation of why you should prefer TinkerPop3 over TinkerPop2.

Of course, I didn’t believe the advantages could be contained in a single paragraph but you be the judge:

Check out http://tinkerpop.com. Apache TinkerPop 3.0.0 was released in June 2015 and it is a quantum leap forward. Not only is it now apart of the Apache Software Foundation, but the Gremlin3 query language has advanced significantly since Gremlin2. The language is much cleaner, provides declarative graph pattern matching constructs, and it supports both OLTP graph databases (e.g. Titan, Neo4j, OrientDB) and OLAP graph processors (e.g. Spark, Giraph). With most every graph vendor providing TinkerPop-connectivity, this should make it easier for developers as they don’t have to learn a new query language for each graph system and developers are less prone to experience vendor lock-in as their code (like JDBC/SQL) can just move to another underlying graph system.

Are my choices developer lock-in versus vendor lock-in? That’s a tough call. 😉

Do check out TinkerPop3!

August 19, 2015

The Gremlin Graph Traversal Language (slides)

Filed under: Graphs,Gremlin — Patrick Durusau @ 7:47 pm

The Gremlin Graph Traversal Language by Marko Rodriguez.

Forty-Five (45) out of fifty (50) slides have working Gremlin code!

Ninety percent (90%) of the slides have code you can enter!

It isn’t as complete as The Gremlin Graph Traversal Machine and Language, but on the other hand, it is a hell of a lot easier to follow along.

Enjoy!

August 18, 2015

The Gremlin Graph Traversal Machine and Language

Filed under: Graphs,Gremlin — Patrick Durusau @ 4:30 pm

The Gremlin Graph Traversal Machine and Language by Marko A. Rodriguez.

Abstract:

Gremlin is a graph traversal machine and language designed, developed, and distributed by the Apache TinkerPop project. Gremlin, as a graph traversal machine, is composed of three interacting components: a graph $$G$$, a traversal $$\Psi$$, and a set of traversers $$T$$. The traversers move about the graph according to the instructions specified in the traversal, where the result of the computation is the ultimate locations of all halted traversers. A Gremlin machine can be executed over any supporting graph computing system such as an OLTP graph database and/or an OLAP graph processor. Gremlin, as a graph traversal language, is a functional language implemented in the user’s native programming language and is used to define the $\Psi$ of a Gremlin machine. This article provides a mathematical description of Gremlin and details its automaton and functional properties. These properties enable Gremlin to naturally support imperative and declarative querying, host language agnosticism, user-defined domain specific languages, an extensible compiler/optimizer, single- and multi-machine execution models, hybrid depth-and breadth-first evaluation, as well as the existence of a Universal Gremlin Machine and its respective entailments.

Why Marko wants to overload terms, like Gremlin, I don’t know. (Hi! Marko!) Despite that overloading, if you are fond of Gremlin (in any sense) and looking for a challenging read, you have found it.

This won’t be a quick read. 😉

Gremlin3 is a declarative query language. (Excellent!)

Static results are an edge case of the dynamic systems they purport to represent. (An insight suggested to me by Sam Hunting.)

Think about it for a moment. There are no non-dynamic systems, only non-dynamic representations of dynamic systems. Which makes non-dynamic representations false, albeit sometimes useful, but also an edge case.

Sorry, didn’t mean to get distracted.

Deeply recommend this “Gremlin” overloaded paper and that you check into the recently released TinkerPop3 release!


Modified 25 November 2015 to point out Gremlin3 is a declarative query language. Thanks to Marko for the catch!

Graphs, Source Code Auditing, Vulnerabilities

Filed under: Cybersecurity,Graphs,Gremlin,Programming,Security — Patrick Durusau @ 1:04 pm

While I was skimming the Praeorian website, I ran across this blog entry: Why You Should Add Joern to Your Source Code Audit Toolkit by Kelby Ludwig.

From the post:

What is Joern?

Joern is a static analysis tool for C / C++ code. It builds a graph that models syntax. The graphs are built out using Joern’s fuzzy parser. The fuzzy parser allows for Joern to parse code that is not necessarily in a working state (i.e., does not have to compile). Joern builds this graph with multiple useful properties that allow users to define meaningful traversals. These traversals can be used to identify potentially vulnerable code with a low false-positive rate.

Joern is easy to set up and import code with. The graph traversals, which are written using a graph database query language called Gremlin, are simple to write and easy to understand.

Why use Joern?

Joern builds a Code Property Graph out of the imported source code. Code Property Graphs combine the properties of Abstract Syntax Trees, Control Flow Graphs, and Program Dependence Graphs. By leveraging various properties from each of these three source code representations, Code Property Graphs can model many different types of vulnerabilities. Code Property Graphs are explained in much greater detail in the whitepaper on the subject. Example queries can be found in a presentation on Joern’s capabilities. While the presentation does an excellent job of demonstrating the impact of running Joern on the source code for the Linux kernel (running two queries led to seven 0-days out of the 11 total results!), we will be running a slightly more general query on a simple code snippet. By following the query outlined in the presentation, we can write similar queries for other potentially dangerous methods.

There are graphs, Gremlin, discovery of zero-day vulnerabilities, this is a post that pushes so many buttons!

Consider it to be a “lite” introduction to Joern, which I have mentioned before.

July 21, 2015

Fusing Narrative with Graphs

Filed under: Graphs,Narrative — Patrick Durusau @ 3:46 pm

Quest for a Narrative Representation of Power Relations by Lambert Strether.

Lamber is looking to meet these requirements:

  1. Be generated algorithmically from data I control….
  2. Have narrative labels on curved arcs. … The arcs must be curved, as the arcs in Figure1 are curved, to fit the graph within the smallest possible (screen) space.
  3. Be pretty. There is an entire literature devoted to making “pretty” graph, starting with making sure arcs don’t cross each other….

The following map was hand crafted and it meets all the visual requirements:

1_full_times_christie

Check out the original here.

Lambert goes on a search for tools that come close to this presentation and also meet the requirements set forth above.

The idea of combining graphs with narrative snippets as links is a deeply intriguing one. Rightly or wrongly I think of it as illustrated narrative but without the usual separation between those two elements.

Suggestions?

July 13, 2015

The impact of fast networks on graph analytics, part 1

Filed under: Graph Analytics,Graphs,GraphX,Rust — Patrick Durusau @ 3:58 pm

The impact of fast networks on graph analytics, part 1 by Frank McSherry.

From the post:

This is a joint post with Malte Schwarzkopf, cross-blogged here and at the CamSaS blog.

tl;dr: A recent NSDI paper argued that data analytics stacks don’t get much faster at tasks like PageRank when given better networking, but this is likely just a property of the stack they evaluated (Spark and GraphX) rather than generally true. A different framework (timely dataflow) goes 6x faster than GraphX on a 1G network, which improves by 3x to 15-17x faster than GraphX on a 10G network.

I spent the past few weeks visiting the CamSaS folks at the University of Cambridge Computer Lab. Together, we did some interesting work, which we – Malte Schwarzkopf and I – are now going to tell you about.

Recently, a paper entitled “Making Sense of Performance in Data Analytics Frameworks” appeared at NSDI 2015. This paper contains some surprising results: in particular, it argues that data analytics stacks are limited more by CPU than they are by network or disk IO. Specifically,

“Network optimizations can only reduce job completion time by a median of at most 2%. The network is not a bottleneck because much less data is sent over the network than is transferred to and from disk. As a result, network I/O is mostly irrelevant to overall performance, even on 1Gbps networks.” (§1)

The measurements were done using Spark, but the authors argue that they generalize to other systems. We thought that this was surprising, as it doesn’t match our experience with other data processing systems. In this blog post, we will look into whether these observations do indeed generalize.

One of the three workloads in the paper is the BDBench query set from Berkeley, which includes a “page-rank-like computation”. Moreover, PageRank also appears as an extra example in the NSDI slide deck (slide 38-39), used there to illustrate that at most a 10% improvement in job completion time can be had even for a network-intensive workload.

This was especially surprising to us because of the recent discussion around whether graph computations require distributed data processing systems at all. Several distributed systems get beat by a simple, single-threaded implementation on a laptop for various graph computations. The common interpretation is that graph computations are communication-limited; the network gets in the way, and you are better off with one machine if the computation fits.[footnote omitted]

The authors introduce Rust and timely dataflow to achieve rather remarkable performance gains. That is if you think a 4x-16x speedup over GraphX on the same hardware is a performance gain. (Most do.)

Code and instructions are available so you can test their conclusions for yourself. Hardware is your responsibility.

While you are waiting for part 2 to arrive, try Frank’s homepage for some fascinating reading.

July 8, 2015

TinkerPop3

Filed under: Graphs,TinkerPop,Titan — Patrick Durusau @ 3:35 pm

TinkerPop3: Taking graph databases and graph analytics to the next level by Matthias Broecheler.

Abstract:

Apache TinkerPop is an open source graph computing framework which includes the graph traversal language Gremlin and a number of graph utilities that speed up the development of graph based applications. Apache TinkerPop provides an abstraction layer on top of popular graph databases like Titan, OrientDB, and Neo4j as well as scalable computation frameworks like Hadoop and Spark allowing developers to build graph applications that run on multiple platforms avoiding vendor lock-in.

This talk gives an overview of the new features introduced in TinkerPop3 with a deep-dive into query language design, query optimization, and the convergence of OLTP and OLAP in graph processing. A demonstration of TinkerPop3 with the scalable Titan graph database illustrates how these concepts work in practice.

It’s not all the information you will need about TinkerPop3 but should be enough to get you interested in learning more, a lot more.

I had a conversation recently on how to process topic maps with graphs, at least if you were willing to abandon the side-effects detailed in the Topic Maps Data Model (TMDM). More on that to follow.

June 15, 2015

Neo4j 2.3.0 Milestone 2 Release

Filed under: Graphs,Neo4j — Patrick Durusau @ 4:32 pm

Neo4j 2.3.0 Milestone 2 Release by Michael Hunger.

New features (not all operational) include:

  • Highly Scalable Off-Heap Graph Cache
  • Mac Installer
  • Cypher Cost-Based Optimizer Improvements
  • Compiled Runtime
  • UX Improvements

And the important information:

Download: http://neo4j.com/download/#milestone

Documentation: http://neo4j.com/docs/milestone/

Cypher Reference Card: http://neo4j.com/docs/milestone/cypher-refcard

Feedback please to: feedback@neotechnology.com

GitHub: http://github.com/neo4j/neo4j/issues

Enjoy!

June 9, 2015

SciGraph

Filed under: Graphs,Neo4j,Ontology — Patrick Durusau @ 5:41 pm

SciGraph

From the webpage:

SciGraph aims to represent ontologies and data described using ontologies as a Neo4j graph. SciGraph reads ontologies with owlapi and ingests ontology formats available to owlapi (OWL, RDF, OBO, TTL, etc). Have a look at how SciGraph translates some simple ontologies.

Goals:

  • OWL 2 Support
  • Provide a simple, usable, Neo4j representation
  • Efficient, parallel ontology ingestion
  • Provide basic “vocabulary” support
  • Stay domain agnostic

Non-goals:

  • Create ontologies based on the graph
  • Reasoning support

Some applications of SciGraph:

  • the Monarch Initiative uses SciGraph for both ontologies and biological data modeling [repaired link] [Monarch enables navigation across a rich landscape of phenotypes, diseases, models, and genes for translational research.]
  • SciCrunch uses SciGraph for vocabulary and annotation services [biomedical but also has US patents?]
  • CINERGI uses SciGraph for vocabulary and annotation services [Community Inventory of EarthCube Resources for Geosciences Interoperability, looks very ripe for a topic map discussion]

If you are interested in representation, modeling or data integration with ontologies, you definitely need to take a look at SciGraph.

Enjoy!

Titan 0.9.0-M2 Release

Filed under: Graphs,TinkerPop,Titan — Patrick Durusau @ 4:02 pm

Titan 0.9.0-M2 Release.

From Dan LaRocque:

Aurelius is pleased to release Titan 0.9.0-M2. 0.9.0-M2 is an experimental release intended for development use.

This release uses TinkerPop 3.0.0.M9-incubating, compared with 3.0.0.M6 in Titan 0.9.0-M1. Source written against Titan 0.5.x and earlier will generally require modification to compile against Titan 0.9.0-M2. As TinkerPop 3 requires a Java 8 runtime, so too does Titan 0.9.0-M2.

While 0.9.0-M1 came out with a separate console and server zip archive, 0.9.0-M2 is a single zipfile with both components. The zipfile is still only packaged with Hadoop 1 to match TP3’s Hadoop support.

http://s3.thinkaurelius.com/downloads/titan/titan-0.9.0-M2-hadoop1.zip

Documentation:

Manual: http://s3.thinkaurelius.com/docs/titan/0.9.0-M2/
Javadoc: http://titan.thinkaurelius.com/javadoc/0.9.0-M2/

The upgrade instructions and changelog for 0.9.0-M2 are in the usual places.

http://s3.thinkaurelius.com/docs/titan/0.9.0-M2/upgrade.html
http://s3.thinkaurelius.com/docs/titan/0.9.0-M2/changelog.html

I have to limit my reading of people who pretend that C/C+ level hacks (OPM) are “…the work of most sophisticated state-sponsored cyber intrusion entities.”

Enjoy!

May 28, 2015

Content Recommendation From Links Shared on Twitter Using Neo4j and Python

Filed under: Cypher,Graphs,Neo4j,Python,Twitter — Patrick Durusau @ 4:50 pm

Content Recommendation From Links Shared on Twitter Using Neo4j and Python by William Lyon.

From the post:

Overview

I’ve spent some time thinking about generating personalized recommendations for articles since I began working on an iOS reading companion for the Pinboard.in bookmarking service. One of the features I want to provide is a feed of recommended articles for my users based on articles they’ve saved and read. In this tutorial we will look at how to implement a similar feature: how to recommend articles for users based on articles they’ve shared on Twitter.

Tools

The main tools we will use are Python and Neo4j, a graph database. We will use Python for fetching the data from Twitter, extracting keywords from the articles shared and for inserting the data into Neo4j. To find recommendations we will use Cypher, the Neo4j query language.

Very clear and complete!

Enjoy!

May 24, 2015

Summarizing and understanding large graphs

Filed under: Data Mining,Graphs — Patrick Durusau @ 3:26 pm

Summarizing and understanding large graphs by Danai Koutra, U Kang, Jilles Vreeken and Christos Faloutsos. (DOI: 10.1002/sam.11267)

Abstract:

How can we succinctly describe a million-node graph with a few simple sentences? Given a large graph, how can we find its most “important” structures, so that we can summarize it and easily visualize it? How can we measure the “importance” of a set of discovered subgraphs in a large graph? Starting with the observation that real graphs often consist of stars, bipartite cores, cliques, and chains, our main idea is to find the most succinct description of a graph in these “vocabulary” terms. To this end, we first mine candidate subgraphs using one or more graph partitioning algorithms. Next, we identify the optimal summarization using the minimum description length (MDL) principle, picking only those subgraphs from the candidates that together yield the best lossless compression of the graph—or, equivalently, that most succinctly describe its adjacency matrix.

Our contributions are threefold: (i) formulation: we provide a principled encoding scheme to identify the vocabulary type of a given subgraph for six structure types prevalent in real-world graphs, (ii) algorithm: we develop VoG, an efficient method to approximate the MDL-optimal summary of a given graph in terms of local graph structures, and (iii) applicability: we report an extensive empirical evaluation on multimillion-edge real graphs, including Flickr and the Notre Dame web graph.

Use the DOI if you need the official citation, otherwise select the title link and it takes you a non-firewalled copy.

A must read if you are trying to extract useful information out of multimillion-edge graphs.

I first saw this in a tweet by Kirk Borne.

May 7, 2015

GQL and SharePoint Online Search REST APIs

Filed under: Graphs,Microsoft — Patrick Durusau @ 7:57 pm

Query the Office graph using GQL and SharePoint Online Search REST APIs

From the post:

Graph Query Language (GQL) is a preliminary query language designed to query the Office graph via the SharePoint Online Search REST API. By using GQL, you can query the Office graph to get items for an actor that satisfies a particular filter.

Note The features and APIs documented in this article are in preview and are subject to change. The current additions to the Search REST API are a preliminary solution to make it possible to query the Office graph, mainly intended for the Office Delve experience. Feel free to experiment with querying the Office graph but do not use these features, or other features and APIs documented in this article, in production. Your feedback about these features and APIs is important. Let us know what you think. Connect with us on Stack Overflow. Tag your questions with [office365].

An interesting development from Microsoft!

Early days so there is a long way to go before we are declaring relationships between entities inside objects and assigning the entities and their relationships properties.

Still, a promising development.

April 16, 2015

Hunting Changes in Complex Networks (Changes in Networks)

Filed under: Astroinformatics,Graphs,Networks — Patrick Durusau @ 6:54 pm

While writing the Methods for visualizing dynamic networks post, I remembered a technique that the authors didn’t discuss.

What if only one node in a complex network was different? That is all of the other nodes and edges remained fixed while one node and it edges changed? How easy would that be to visualize?

If that sounds like an odd use case, it’s not. In fact, the discovery of Pluto in the 1930’s was made using a blink comparator exactly for that purpose.

blink

This is Cyrus Tombaugh using a blink comparator which shows the viewer two images, quickly alternating between them. The images are of the same parts of the night sky and anything that has changed with be quickly noticed by the human eye.

plutodisc_noarrows

Select the star field image to get a larger view and the gif will animate as though seen through a blink comparator. Do you see Pluto? (These are images of the original discovery plates.)

If not, see these http://upload.wikimedia.org/wikipedia/en/c/c6/Pluto_discovery_plates.pngplates with Pluto marked by a large arrow in each one.

This wonderful material on Pluto came from: Beyond the Planets – the discovery of Pluto

All of that was to interest you in reading: GrepNova: A tool for amateur supernova hunting by Frank Dominic.

From the article:

This paper presents GrepNova, a software package which assists amateur supernova hunters by allowing new observations of galaxies to be compared against historical library images in a highly automated fashion. As each new observation is imported, GrepNova automatically identifies a suitable comparison image and rotates it into a common orientation with the new image. The pair can then be blinked on the computer’s display to allow a rapid visual search to be made for stars in outburst. GrepNova has been in use by Tom Boles at his observatory in Coddenham, Suffolk since 2005 August, where it has assisted in the discovery of 50 supernovae up to 2011 October.

That’s right, these folks are searching for supernovas in other galaxies, each of which consists of millions of stars, far denser than most contact networks.

The download information for GrepNova has changed since the article was published: https://in-the-sky.org/software.php.

I don’t have any phone metadata to try the experiment on but with a graph of contacts, the usual contacts will simply be background and new contacts will jump off the screen at you.

A great illustration of why prior searching techniques remain relevant to modern “information busy” visualizations.

April 14, 2015

Attribute-Based Access Control with a graph database [Topic Maps at NIST?]

Filed under: Cybersecurity,Graphs,Neo4j,NIST,Security,Subject Identity,Topic Maps — Patrick Durusau @ 3:25 pm

Attribute-Based Access Control with a graph database by Robin Bramley.

From the post:

Traditional access control relies on the identity of a user, their role or their group memberships. This can become awkward to manage, particularly when other factors such as time of day, or network location come into play. These additional factors, or attributes, require a different approach, the US National Institute of Standards and Technology (NIST) have published a draft special paper (NIST 800-162) on Attribute-Based Access Control (ABAC).

This post, and the accompanying Graph Gist, explore the suitability of using a graph database to support policy decisions.

Before we dive into the detail, it’s probably worth mentioning that I saw the recent GraphGist on Entitlements and Access Control Management and that reminded me to publish my Attribute-Based Access Control GraphGist that I’d written some time ago, originally in a local instance having followed Stefan Armbruster’s post about using Docker for that very purpose.

Using a Property Graph, we can model attributes using relationships and/or properties. Fine-grained relationships without qualifier properties make patterns easier to spot in visualisations and are more performant. For the example provided in the gist, the attributes are defined using solely fine-grained relationships.

Graph visualization (and querying) of attribute-based access control.

I found this portion of the NIST draft particularly interesting:


There are characteristics or attributes of a subject such as name, date of birth, home address, training record, and job function that may, either individually or when combined, comprise a unique identity that distinguishes that person from all others. These characteristics are often called subject attributes. The term subject attributes is used consistently throughout this document.

In the course of a person’s life, he or she may work for different organizations, may act in different roles, and may inherit different privileges tied to those roles. The person may establish different personas for each organization or role and amass different attributes related to each persona. For example, an individual may work for Company A as a gate guard during the week and may work for Company B as a shift manager on the weekend. The subject attributes are different for each persona. Although trained and qualified as a Gate Guard for Company A, while operating in her Company B persona as a shift manager on the weekend she does not have the authority to perform as a Gate Guard for Company B.
…(emphasis in the original)

Clearly NIST recognizes that subjects, at least in the sense of people, are identified by a set of “subject attributes” that uniquely identify that subject. It doesn’t seem like much of a leap to recognize that for other subjects, including the attributes used to identify subjects.

I don’t know what other US government agencies have similar language but it sounds like a starting point for a robust discussion of topic maps and their advantages.

Yes?

Importing the Hacker News Interest Graph

Filed under: Graphs,Neo4j — Patrick Durusau @ 6:58 am

Importing the Hacker News Interest Graph by Max De Marzi.

From the post:

Graphs are everywhere. Think about the computer networks that allow you to read this sentence, the road or train networks that get you to work, the social network that surrounds you and the interest graph that holds your attention. Everywhere you look, graphs. If you manage to look somewhere and you don’t see a graph, then you may be looking at an opportunity to build one. Today we are going to do just that. We are going to make use of the new Neo4j Import tool to build a graph of the things that interest Hacker News.

The basic premise of Hacker News is that people post a link to a Story, people read it, and comment on what they read and the comments of other people. We could try to extract a Social Graph of people who interact with each other, but that wouldn’t be super helpful. Want to know the latest comment Patio11 made? You’ll have to find their profile and the threads they participated in. Unlike Facebook, Twitter or other social networks, Hacker News is an open forum.

A good starting point if you want to build a graph of Hacker News.

Enjoy!

March 31, 2015

Graph Resources for Neo4j

Filed under: Graphs,Neo4j — Patrick Durusau @ 8:43 am

GitHub – GraphAware

A small sampling of what you will find at GraphAware’s GitHub page:

GithubNeo4j – Demo Application importing User Github Public Events into Neo4j.

neo4j-timetree – Java and REST APIs for working with time-representing tree in Neo4j.

neo4j-changefeed – A GraphAware Framework Runtime Module allowing users to find out what were the latest changes performed on the graph.

Others await your discovery at: GitHub – GraphAware

Enjoy!

I first saw this in a tweet by Jeremy Deane.

March 19, 2015

Detecting potential typos using EXPLAIN

Filed under: Cypher,Graphs,Neo4j — Patrick Durusau @ 7:10 pm

Detecting potential typos using EXPLAIN by Mark Needham.

Mark illustrates use of EXPLAIN (in Neo4j 2.2.0 RC1) to detect typos (not potential, actual typos) to debug a query.

Now if I could just find a way to incorporate EXPLAIN into documentation prose.

PS: I say that in jest but using a graph model, it should be possible to create a path through documentation that highlights the context of a particular point in the documentation. Trivial example: I find “setting margin size” but don’t know how that relates to menus in an application. “Explain” in that context displays a graph with the nodes necessary to guide me to other parts of the documentation. Each of those nodes might have additional information at each of their “contexts.”

March 16, 2015

Grafter RDF Utensil

Filed under: Clojure,DSL,Graphs,Linked Data,RDF — Patrick Durusau @ 4:11 pm

Grafter RDF Utensil

From the homepage:

grafter

Easy Data Curation, Creation and Conversion

Grafter’s DSL makes it easy to transform tabular data from one tabular format to another. We also provide ways to translate tabular data into Linked Graph Data.

Data Formats

Grafter currently supports processing CSV and Excel files, with additional formats including Geo formats & shape files coming soon.

Separation of Concerns

Grafter’s design has a clear separation of concerns, disentangling tabular data processing from graph conversion and loading.

Incanter Interoperability

Grafter uses Incanter’s datasets, making it easy to incororate advanced statistical processing features with your data transformation pipelines.

Stream Processing

Grafter transformations build on Clojure’s laziness, meaning you can process large amounts of data without worrying about memory.

Linked Data Templates

Describe the linked data you want to create using simple templates that look and feel like Turtle.

Even if Grafter wasn’t a DSL, written in Clojure, producing graph output, I would have been compelled to mention it because of the cool logo!

Enjoy!

I first saw this in a tweet by ClojureWerkz.

March 11, 2015

Getting Started with Apache Spark and Neo4j Using Docker Compose

Filed under: Graphs,Neo4j,Spark — Patrick Durusau @ 4:08 pm

Getting Started with Apache Spark and Neo4j Using Docker Compose by Kenny Bastani.

From the post:

I’ve received a lot of interest since announcing Neo4j Mazerunner. People from around the world have reached out to me and are excited about the possibilities of using Apache Spark and Neo4j together. From authors who are writing new books about big data to PhD researchers who need it to solve the world’s most challenging problems.

I’m glad to see such a wide range of needs for a simple integration like this. Spark and Neo4j are two great open source projects that are focusing on doing one thing very well. Integrating both products together makes for an awesome result.

Less is always more, simpler is always better.

Both Apache Spark and Neo4j are two tremendously useful tools. I’ve seen how both of these two tools give their users a way to transform problems that start out both large and complex into problems that become simpler and easier to solve. That’s what the companies behind these platforms are getting at. They are two sides of the same coin.

One tool solves for scaling the size, complexity, and retrieval of data, while the other is solving for the complexity of processing the enormity of data by distributed computation at scale. Both of these products are achieving this without sacrificing ease of use.

Inspired by this, I’ve been working to make the integration in Neo4j Mazerunner easier to install and deploy. I believe I’ve taken a step forward in this and I’m excited to announce it in this blog post.

….

Now for something a bit more esoteric than CSV. 😉

This guide will get you into Docker land as well.

Please share and forward.

Enjoy!

March 10, 2015

MapGraph [Graphs, GPUs, 30 GTEPS (30 billion traversed edges per second)]

Filed under: bigdata®,GPU,Graphs,MapGraph — Patrick Durusau @ 4:40 pm

MapGraph [Graphs, GPUs, 30 GTEPS (30 billion traversed edges per second)]

From the post:

MapGraph is Massively Parallel Graph processing on GPUs. (Previously known as “MPGraph”).

  • The MapGraph API makes it easy to develop high performance graph analytics on GPUs. The API is based on the Gather-Apply-Scatter (GAS) model as used in GraphLab. To deliver high performance computation and efficiently utilize the high memory bandwidth of GPUs, MapGraph’s CUDA kernels use multiple sophisticated strategies, such as vertex-degree-dependent dynamic parallelism granularity and frontier compaction.
  • New algorithms can be implemented in a few hours that fully exploit the data-level parallelism of the GPU and offer throughput of up to 3 billion traversed edges per second on a single GPU.
  • Preliminary results for the multi-GPU version of MapGraph have traversal rates of nearly 30 GTEPS (30 billion traversed edges per second) on a scale-free random graph with 4.3 billion directed edges using a 64 GPU cluster. See the multi-GPU paper referenced below for details.
  • The MapGraph API also comes in a CPU-only version that is currently packaged and distributed with the bigdata open-source graph database. GAS programs operate over the graph data loaded into the database and are accessed via either a Java API or a SPARQL 1.1 Service Call . Packaging the GPU version inside bigdata will be in a future release.

MapGraph is under the Apache 2 license. You can download MapGraph from http://sourceforge.net/projects/mpgraph/ . For the lastest version of this documentation, see http://mapgraph.io. You can subscribe to receive notice for future updates on the project home page. For open source support, please ask a question on the MapGraph mailing lists or file a ticket. To inquire about commercial support, please email us at licenses@bigdata.com. You can follow MapGraph and the bigdata graph database platform at http://www.bigdata.com/blog.

This work was (partially) funded by the DARPA XDATA program under AFRL Contract #FA8750-13-C-0002.

This material is based upon work supported by the Defense Advanced Research Projects Agency (DARPA) under Contract No. D14PC00029.

MapGraph Publications

You do have to wonder when the folks at Systap sleep. 😉 This is the same group that produced BlazeGraph, recently adopted by WikiData. Granting WikiData only has 13.6 million data items as of today but it isn’t “small” data.

The rest of the page has additional pointers and explanations for MapGraph.

Enjoy!

March 8, 2015

Blazegraph™ Selected by Wikimedia Foundation to Power the Wikidata Query Service

Filed under: Blazegraph,Graphs,RDF,SPARQL — Patrick Durusau @ 11:03 am

Blazegraph™ Selected by Wikimedia Foundation to Power the Wikidata Query Service by Brad Bebee.

From the post:

Blazegraph™ has been selected by the Wikimedia Foundation to be the graph database platform for the Wikidata Query Service. Read the Wikidata announcement here. Blazegraph™ was chosen over Titan, Neo4j, Graph-X, and others by Wikimedia in their evaluation. There’s a spreadsheet link in the selection message, which has quite an interesting comparison of graph database platforms.

Wikidata acts as central storage for the structured data of its Wikimedia sister projects including Wikipedia, Wikivoyage, Wikisource, and others. The Wikidata Query Service is a new capability being developed to allow users to be able to query and curate the knowledge base contained in Wikidata.

We’re super-psyched to be working with Wikidata and think it will be a great thing for Wikidata and Blazegraph™.

From the Blazegraph™ SourceForge page:

Blazegraph™is SYSTAP’s flagship graph database. It is specifically designed to support big graphs offering both Semantic Web (RDF/SPARQL) and Graph Database (tinkerpop, blueprints, vertex-centric) APIs. It is built on the same open source GPLv2 platform and maintains 100% binary and API compatibility with Bigdata®. It features robust, scalable, fault-tolerant, enterprise-class storage and query and high-availability with online backup, failover and self-healing. It is in production use with enterprises such as Autodesk, EMC, Yahoo7!, and many others. Blazegraph™ provides both embedded and standalone modes of operation.

Blazegraph has a High Availability and Scale Out architecture. It provides robust support for Semantic Web (RDF/SPARQ)L and Property Graph (Tinkerpop) APIs. Highly scalable Blazegraph graph can handle 50 Billion edges.

The Blazegraph wiki, which has forty-three (43) substantive links to further details on Blazegraph.

For an even deeper look, consider these white papers:

Enjoy!

February 27, 2015

Making Master Data Management Fun with Neo4j – Part 1, 2

Filed under: Graphs,Neo4j — Patrick Durusau @ 3:29 pm

Making Master Data Management Fun with Neo4j – Part 1 by Brian Underwood.

From Part 1:

Joining multiple disparate data-sources, commonly dubbed Master Data Management (MDM), is usually not a fun exercise. I would like to show you how to use a graph database (Neo4j) and an interesting dataset (developer-oriented collaboration sites) to make MDM an enjoyable experience. This approach will allow you to quickly and sensibly merge data from different sources into a consistent picture and query across the data efficiently to answer your most pressing questions.

To start I’ll just be importing one data source: StackOverflow questions tagged with neo4j and their answers. In future blog posts I will discuss how to integrate other data sources into a single graph database to provide a richer view of the world of Neo4j developers’ online social interactions.

I’ve created a GraphGist to explore questions about the imported data, but in this post I’d like to briefly discuss the process of getting data from StackOverflow into Neo4j.

Part 1 imports data from Stackover flow into Neoj.

Making Master Data Management Fun with Neo4j – Part 2 imports Github data:

All together I was able to import:

  • 6,337 repositories
  • 6,232 users
  • 11,011 issues
  • 474 commits
  • 22,676 comments

In my next post I’ll show the process of how I linked the orignal StackOveflow data with the new GitHub data. Stay tuned for that, but in the meantime I’d also like to share the more technical details of what I did for those who are interested.

Definitely looking forward to seeing the reconciliation of data between StackOverflow and GitHub.

February 23, 2015

Integer sequence discovery from small graphs

Filed under: Graph Generator,Graphs,Mathematics — Patrick Durusau @ 11:36 am

Integer sequence discovery from small graphs by Travis Hoppe and Anna Petrone.

Abstract:

We have exhaustively enumerated all simple, connected graphs of a finite order and have computed a selection of invariants over this set. Integer sequences were constructed from these invariants and checked against the Online Encyclopedia of Integer Sequences (OEIS). 141 new sequences were added and 6 sequences were appended or corrected. From the graph database, we were able to programmatically suggest relationships among the invariants. It will be shown that we can readily visualize any sequence of graphs with a given criteria. The code has been released as an open-source framework for further analysis and the database was constructed to be extensible to invariants not considered in this work.

See also:

Encyclopedia of Finite Graphs “Set of tools and data to compute all known invariants for simple connected graphs”

Simple-connected-graph-invariant-database “The database file for the Encyclopedia of Finite Graphs (simple connected graphs up to order 10)”

From the paper:

A graph invariant is any property that is preserved under isomorphism. Invariants can be simple binary properties (planarity), integers (automorphism group size), polynomials (chromatic polynomials), rationals (fractional chromatic numbers), complex numbers (adjacency spectra), sets (dominion sets) or even graphs themselves (subgraph and minor matching).

Hmmm, perhaps an illustration, also from the paper, might explain better:

invariant

Figure 1: An example query to the Encyclopedia using speci c invariant conditions. The command python viewer.py 10 -i is bipartite 1 -i is integral 1 -i is eulerian 1 displays the three graphs that are simultaneously bipartite, integral and Eulerian with ten vertices.

For analysis of “cells” of your favorite evil doers you can draw higgly-piggly graphs with nodes and arcs on a whiteboard or you can take advantage of formal analysis of small graphs, research on the organization of small groups, and the history of that particular group. With the higgly-piggly approach you risk missing connections that aren’t possible to represent from your starting point.

February 22, 2015

Neo4j: Building a topic graph with Prismatic Interest Graph API

Filed under: Graphs,Natural Language Processing,Neo4j,Topic Models (LDA) — Patrick Durusau @ 4:44 pm

Neo4j: Building a topic graph with Prismatic Interest Graph API by Mark Needham.

From the post:

Over the last few weeks I’ve been using various NLP libraries to derive topics for my corpus of How I met your mother episodes without success and was therefore enthused to see the release of Prismatic’s Interest Graph API.

The Interest Graph API exposes a web service to which you feed a block of text and get back a set of topics and associated score.

It has been trained over the last few years with millions of articles that people share on their social media accounts and in my experience using Prismatic the topics have been very useful for finding new material to read.

A great walk through from accessing the Interest Graph API to loading the data into Neo4j and querying it with Cypher.

I can’t profess a lot of interest in How I Met Your Mother episodes but the techniques can be applied to other content. 😉

« Newer PostsOlder Posts »

Powered by WordPress