Another Word For It Patrick Durusau on Topic Maps and Semantic Diversity

December 14, 2015

Data Science Lessons [Why You Need To Practice Programming]

Filed under: Data Science,Programming,Python — Patrick Durusau @ 7:30 pm

Data Science Lessons by Shantnu Tiwari.

Shantnu has authored several programming books using Python and has a series of videos (with more forthcoming) on doing data science with Python.

Shantnu had me when he used data from the Hubble Space telescope in his Introduction to Pandas with Practical examples.

The videos build one upon another and new users will appreciate that not very move is the correct one. 😉

If I had to pick one video to share, of those presently available, it would be:

Why You Need To Practice Programming.

It’s not new advice but it certainly is advice that needs repeating.

This anecdote is told about Pablo Casals (world famous cellist):

When Casals (then age 93) was asked why he continued to practice the cello three hours a day, he replied, “I’m beginning to notice some improvement.”

What are you practicing three hours a day?

December 13, 2015

Data Science Learning Club

Filed under: Data Science,Education — Patrick Durusau @ 8:11 pm

Data Science Learning Club by Renee Teate.

From the Hello and welcome message:

I’m Renee Teate, the host of the Becoming a Data Scientist Podcast, and I started this club so data science learners can work on projects together. Please browse the activities and see what we’re up to!

What is the Data Science Learning Club?

This learning club was created as part of the Becoming a Data Scientist Podcast [coming soon!]. Each episode, there is a “learning activity” announced. Anyone can come here to the club forum to get details and resources, participate in the activity, and share their results.

Participants can use any technology and any programming language to do the activities, though I expect most will use python or R. No one is “teaching” how to do the activity, we’ll just share resources and all do the activity during the same time period so we can help each other out if needed.

How do I participate?

Just register for a free account, and start learning!

If you’re joining in a “live” activity during the 2 weeks after a podcast episode airs (the original “assignment” period listed in the forum description), then you can expect others to be doing the activity at the same time and helping each other out. If you’re working through the activities from the beginning after the original assignment period is over, you can browse the existing posts for help and you can still post your results. If you have trouble, feel free to post a question, but you may not get a timely response if the activity isn’t the current one.

  • If you are brand new to data science, you may want to start at activity 00 and work your way through each activity with the help of the information in posts by people that did it before you. I plan to make them increase in difficulty as we go along, and they may build on one another. You may be able to skip some activities without missing out on much, and also if you finish more than 1 activity every 2 weeks, you will be going faster than new activities are posted and will catch up.
  • If you know enough to have done most of the prior activities on your own, you don’t have to start from the beginning. Join the current activity (latest one posted) with the “live” group and participate in the activity along with us.
  • If you are more advanced, please join in anyway! You can work through activities for practice and help out anyone that is struggling. Show off what you can do and write tutorials to share!

If you have challenges during the activity and overcome them on your own, please post about it and share what you did in case others come across the same challenges. Once you have success, please post about your experience and share your good results! If you write a post or tutorial on your own blog, write a brief summary and post a link to it, and I’ll check it out and promote the most helpful ones.

The only “dues” for being a member of the club are to participate in as many activities as possible, share as much of your work as you can, give constructive feedback to others, and help each other out as needed!

I look forward to this series of learning activities, and I’ll be participating along with you!

Renee’s Data Science Learning Club is due to go live on December 14, 2015!

With the various free courses, Stack Overflow and similar resources, it will be interesting to see how this develops.

Hopefully recurrent questions will develop into tutorials culled from discussions. That hasn’t happened with Stack Overflow, not that I am aware of, but perhaps it will happen here.

Stop by and see how the site develops!

December 12, 2015

DataGenetics (blog)

Filed under: Data Science,Mathematical Reasoning,Narrative,Reasoning — Patrick Durusau @ 5:09 pm

DataGenetics (blog) by Nick Berry.

I mentioned Nick’s post Estimating “known unknowns” but his blog merits more than a mention of that one post.

As of today, Nick has 217 posts that touch on topics relevant to data science and have illustrations that make them memorable. You will remember those illustrations for discussions among data scientists, customers and even data science interviewers.

Follow Berry’s posts long enough and you may acquire the skill of illustrating data science ideas and problems in straight-forward prose.

Good luck!

Estimating “known unknowns”

Filed under: Data Science,Mathematics,Probability,Proofing,Statistics — Patrick Durusau @ 4:36 pm

Estimating “known unknowns” by Nick Berry.

From the post:

There’s a famous quote from former Secretary of Defense Donald Rumsfeld:

“ … there are known knowns; there are things we know we know. We also know there are known unknowns; that is to say we know there are some things we do not know. But there are also unknown unknowns – the ones we don’t know we don’t know.”

I write this blog. I’m an engineer. Whilst I do my best and try to proof read, often mistakes creep in. I know there are probably mistakes in just about everything I write! How would I go about estimating the number of errors?

The idea for this article came from a book I recently read by Paul J. Nahin, entitled Duelling Idiots and Other Probability Puzzlers (In turn, referencing earlier work by the eminent mathematician George Pólya).

Proof Reading2

Imagine I write a (non-trivially short) document and give it to two proof readers to check. These two readers (independantly) proof read the manuscript looking for errors, highlighting each one they find.

Just like me, these proof readers are not perfect. They, also, are not going to find all the errors in the document.

Because they work independently, there is a chance that reader #1 will find some errors that reader #2 does not (and vice versa), and there could be errors that are found by both readers. What we are trying to do is get an estimate for the number of unseen errors (errors detected by neither of the proof readers).*

*An alternate way of thinking of this is to get an estimate for the total number of errors in the document (from which we can subtract the distinct number of errors found to give an estimate to the number of unseen errros.

A highly entertaining posts on estimating “known unknowns,” such as the number of errors in a paper that has been proofed by two independent proof readers.

Of more than passing interest to me because I am involved in a New Testament Greek Lexicon project that is an XML encoding of a 500+ page Greek lexicon.

The working text is in XML, but not every feature of the original lexicon was captured in markup and even if that were true, we would still want to improve upon features offered by the lexicon. All of which depend upon the correctness of the original markup.

You will find Nick’s analysis interesting and more than that, memorable. Just in case you are asked about “estimating ‘known unknowns'” in a data science interview.

Only Rumsfeld could tell you how to estimate an “unknown unknowns.” I think it goes: “Watch me pull a number out of my ….”

😉

I was found this post by following another post at this site, which was cited by Data Science Renee.

December 4, 2015

3 ways to win “Practical Data Science with R”! (Contest ends December 12, 2015 at 11:59pm EST)

Filed under: Contest,Data Science,R — Patrick Durusau @ 5:25 pm

3 ways to win “Practical Data Science with R”!.

Renee is running a contest to give away three copies of “Practical Data Science with R” by Nina Zumel and John Mount!

You must enter on or before December 12, 2015 at 11:59pm EST.

Three ways to win, see Renee’s post for the details!

November 22, 2015

A Challenge to Data Scientists

Filed under: Bias,Data Science — Patrick Durusau @ 1:25 pm

A Challenge to Data Scientists by Renee Teate.

From the post:

As data scientists, we are aware that bias exists in the world. We read up on stories about how cognitive biases can affect decision-making. We know that, for instance, a resume with a white-sounding name will receive a different response than the same resume with a black-sounding name, and that writers of performance reviews use different language to describe contributions by women and men in the workplace. We read stories in the news about ageism in healthcare and racism in mortgage lending.

Data scientists are problem solvers at heart, and we love our data and our algorithms that sometimes seem to work like magic, so we may be inclined to try to solve these problems stemming from human bias by turning the decisions over to machines. Most people seem to believe that machines are less biased and more pure in their decision-making – that the data tells the truth, that the machines won’t discriminate.

Renee’s post summarizes a lot of information about bias, inside and outside of data science and issues this challenge:

Data scientists, I challenge you. I challenge you to figure out how to make the systems you design as fair as possible.

An admirable sentiment but one hard part is defining “…as fair as possible.”

Being professionally trained in a day to day “hermeneutic of suspicion,” as opposed to Paul Ricoeur‘s analysis of texts (Paul Ricoeur and the Hermeneutics of Suspicion: A Brief Overview and Critique by G.D. Robinson.), I have yet to encounter a definition of “fair” that does not define winners and losers.

Data science relies on classification, which has as its avowed purpose the separation of items into different categories. Some categories will be treated differently than others. Otherwise there would be no reason to perform the classification.

Another hard part is that employers of data scientists are more likely to say:

Analyze data X for market segments responding to ad campaign Y.

As opposed to:

What do you think about our ads targeting tweens by the use of sexual-content for our unhealthy product A?

Or change the questions to fit those asked of data scientists at any government intelligence agency.

The vast majority of data scientists are hired as data scientists, not amateur theologians.

Competence in data science has no demonstrable relationship to competence in ethics, fairness, morality, etc. Data scientists can have opinions about the same but shouldn’t presume to poach on other areas of expertise.

How you would feel if a competent user of spreadsheets decided to label themselves a “data scientist?”

Keep that in mind the next time someone starts to pontificate on “ethics” in data science.

PS: Renee is in the process of creating and assembling high quality resources for anyone interested in data science. Be sure to explore her blog and other links after reading her post.
October 19, 2015

Introduction to Data Science (3rd Edition)

Filed under: Data Science,R — Patrick Durusau @ 9:05 pm

Introduction to Data Science, 3rd Edition by Jeffrey Stanton.

From the webpage:

In this Introduction to Data Science eBook, a series of data problems of increasing complexity is used to illustrate the skills and capabilities needed by data scientists. The open source data analysis program known as “R” and its graphical user interface companion “R-Studio” are used to work with real data examples to illustrate both the challenges of data science and some of the techniques used to address those challenges. To the greatest extent possible, real datasets reflecting important contemporary issues are used as the basis of the discussions.

A very good introductory text on data science.

I originally saw a tweet about the second edition but searching on the title and Stanton uncovered this later version.

In the timeless world of the WWW, the amount of out-dated information vastly exceeds the latest. Check for updates before broadcasting your latest “find.”

October 18, 2015

16+ Free Data Science Books

Filed under: Books,Data Science — Patrick Durusau @ 8:25 pm

16+ Free Data Science Books by William Chen.

From the webpage:

As a data scientist at Quora, I often get asked for my advice about becoming a data scientist. To help those people, I’ve took some time to compile my top recommendations of quality data science books that are either available for free (by generosity of the author) or are Pay What You Want (PWYW) with $0 minimum.

Please bookmark this place and refer to it often! Click on the book covers to take yourself to the free versions of the book. I’ve also provided Amazon links (when applicable) in my descriptions in case you want to buy a physical copy. There’s actually more than 16 free books here since I’ve added a few since conception, but I’m keeping the name of this website for recognition.

The authors of these books have put in much effort to produce these free resources – please consider supporting them through avenues that the authors provide, such as contributing via PWYW or buying a hard copy [Disclosure: I get a small commission via the Amazon links, and I am co-author of one of these books].

Some of the usual suspects are here along with some unexpected titles, such as A First Course in Design and Analysis of Experiments by Gary W. Oehlert.

From the introduction:

Researchers use experiments to answer questions. Typical questions might be:

  • Is a drug a safe, effective cure for a disease? This could be a test of how AZT affects the progress of AIDS
  • Which combination of protein and carbohydrate sources provides the best nutrition for growing lambs?
  • How will long-distance telephone usage change if our company offers a different rate structure to our customers
  • Will an ice cream manufactured with a new kind of stabilizer be as palatable as our current ice cream?
  • Does short-term incarceration of spouse abusers deter future assaults?
  • Under what conditions should I operate my chemical refinery, given this month’s grade of raw material?

This book is meant to help decision makers and researchers design good experiments, analyze them properly, and answer their questions.

It isn’t short, six hundred and fifty-nine pages, but taken in small doses you will learn a great deal about experimental design. Not only how to properly design experiments but how to spot when they aren’t well designed.

Think of it as training to go big-game hunting in the latest issue of Nature or Science. Adds a bit of competitiveness to the enterprise.

October 7, 2015

Some key Win-Vector serial data science articles

Filed under: Data Science,R,Statistics — Patrick Durusau @ 8:20 pm

Some key Win-Vector serial data science articles by John Mount.

From the post:

As readers have surely noticed the Win-Vector LLC blog isn’t a stream of short notes, but instead a collection of long technical articles. It is the only way we can properly treat topics of consequence.

  • Statistics to English translation.

    This series tries to find vibrant applications and explanations of standard good statistical practices, to make them more approachable to the non statistician.

  • Statistics as it should be.

    This series tries to cover cutting edge machine learning techniques, and then adapt and explain them in traditional statistical terms.

  • R as it is.

    This series tries to teach the statistical programming language R “warts and all” so we can see it as the versatile and powerful data science tool that it is.

More than enough reasons to start haunting the the Win-Vector LLC blog on a regular basis.

Perhaps an inspiration to do more long-form posts as well.

September 26, 2015

Free Data Science Books (Update, + 53 books, 117 total)

Filed under: Books,Data Science — Patrick Durusau @ 8:34 pm

Free Data Science Books (Update).

From the post:

Pulled from the web, here is a great collection of eBooks (most of which have a physical version that you can purchase on Amazon) written on the topics of Data Science, Business Analytics, Data Mining, Big Data, Machine Learning, Algorithms, Data Science Tools, and Programming Languages for Data Science.

While every single book in this list is provided for free, if you find any particularly helpful consider purchasing the printed version. The authors spent a great deal of time putting these resources together and I’m sure they would all appreciate the support!

Note: Updated books as of 9/21/15 are post-fixed with an asterisk (*). Scroll to updates

Great news but also more content.

Unlike big data, you have to read this content in detail to obtain any benefit from it.

And books in the same area are going to have overlapping content as well as some unique content.

Imagine how useful it would be to compose a free standing work with the “best” parts from several works.

Copyright laws would be a larger barrier but no more than if you cut-n-pasted your own version for personal use.

If such an approach could be made easy enough, the resulting value would drown out dissenting voices.

I think PDF is the principal practical barrier.

Do you suspect others?

I first saw this in a tweet by Kirk Borne.

Data Science Glossary

Filed under: Data Science,Glossary — Patrick Durusau @ 8:10 pm

Data Science Glossary by Bob DuCharme.

From the about page:

Terms included in this glossary are the kind that typically come up in data science discussions and job postings. Most are from the worlds of statistics, machine learning, and software development. A Wikipedia entry icon links to the corresponding Wikipedia entry, although these are often quite technical. Email corrections and suggestions to bob at this domain name.

Is your favorite term included?

You can follow Bob on Twitter @bobdc.

Or read his blog at: bobdc.blog.

Thanks Bob!

September 14, 2015

Data Science from Scratch

Filed under: Data Science,Python — Patrick Durusau @ 8:30 pm

Data Science from Scratch by Joel Grus.

Joel provides a whirlwind tour of Python that is part of the employee orientation at DataSciencester. Not everything you need to know about Python but a good sketch of why it is important to data scientists.

I first saw this in a tweet by Kirk Borne.

August 29, 2015

DataPyR

Filed under: Data Science,Python,R — Patrick Durusau @ 3:19 pm

DataPyR by Kranthi Kumar.

Twenty (20) lists of programming resources on data science, Python and R.

A much easier collection of resources to scan than attempting to search for resources on any of these topics.

At the same time, you have to visit each resource and mine it for an answer to any particular problem.

For example, there is a list of Python Packages for Datamining, which is useful, but even more useful would be a list of common datamining tasks with pointers to particular data mining libraries. That would enable users to search across multiple libraries by task, as opposed to exploring each library.

Expand that across a set of resources on data science, Python and R and you’re talking about saving time and resources across the entire community.

I first saw this in a tweet by Kirk Borne.

July 26, 2015

Learning Data Science Using Functional Python

Filed under: Data Science,Functional Programming,Python — Patrick Durusau @ 8:14 pm

Learning Data Science Using Functional Python by Joel Grus.

Something fun to start the week off!

Apologies for the “lite” posting of late. I am munging some small but very ugly data for a report this coming week. The data sources range from spreadsheets to forms delivered in PDF, in no particular order and some without the original numbering. What fun!

Complaints about updating URLs that were redirects were meet with replies that “private redirects” weren’t of interest and they would continue to use the original URLs. Something tells me the responsible parties didn’t quite get what URL redirects are about.

Another day or so and I will be back at full force with more background on the Balisage presentation and more useful posts every day.

June 28, 2015

Medical Sieve [Information Sieve]

Filed under: Bioinformatics,Data Science,Medical Informatics — Patrick Durusau @ 4:35 pm

Medical Sieve

An effort to capture anomalies from medical imaging, package those with other data, and deliver it for use by clinicians.

If you think of each medical image as represented a large amount of data, the underlying idea is to filter out all but the most relevant data, so that clinicians are not confronting an overload of information.

In network terms, rather than displaying all of the current connections to a network (the ever popular eye-candy view of connections), displaying only those connections that are different from all the rest.

The same technique could be usefully applied in a number of “big data” areas.

From the post:

Medical Sieve is an ambitious long-term exploratory grand challenge project to build a next generation cognitive assistant with advanced multimodal analytics, clinical knowledge and reasoning capabilities that is qualified to assist in clinical decision making in radiology and cardiology. It will exhibit a deep understanding of diseases and their interpretation in multiple modalities (X-ray, Ultrasound, CT, MRI, PET, Clinical text) covering various radiology and cardiology specialties. The project aims at producing a sieve that filters essential clinical and diagnostic imaging information to form anomaly-driven summaries and recommendations that tremendously reduce the viewing load of clinicians without negatively impacting diagnosis.

Statistics show that eye fatigue is a common problem with radiologists as they visually examine a large number of images per day. An emergency room radiologist may look at as many 200 cases a day, and some of these imaging studies, particulary lower body CT angiography can be as many as 3000 images per study. Due to the volume overload, and limited amount of clinical information available as part of imaging studies, diagnosis errors, particularly relating to conincidental diagnosis cases can occur. With radiologists also being a scarce resource in many countries, it will even more important to reduce the volume of data to be seen by clinicians particularly, when they have to be sent over low bandwidth teleradiology networks.

MedicalSieve is an image-guided informatics system that acts as a medical sieve filtering the essential clinical information physicians need to know about the patient for diagnosis and treatment planning. The system gathers clinical data about the patient from a variety of enterprise systems in hospitals including EMR, pharmacy, labs, ADT, and radiology/cardiology PACs systems using HL7 and DICOM adapters. It then uses sophisticated medical text and image processing, pattern recognition and machine learning techniques guided by advanced clinical knowledge to process clinical data about the patient to extract meaningful summaries indicating the anomalies. Finally, it creates advanced summaries of imaging studies capturing the salient anomalies detected in various viewpoints.

Medical Sieve is leading the way in diagnostic interpretation of medical imaging datasets guided by clinical knowledge with many first-time inventions including (a) the first fully automatic spatio-temporal coronary stenosis detection and localization from 2D X-ray angiography studies, (b) novel methods for highly accurate benign/malignant discrimination in breast imaging, and (c) first automated production of AHA guideline17 segment model for cardiac MRI diagnosis.

For more details on the project, please contact Tanveer Syeda-Mahmood (>stf@us.ibm.com).

You can watch a demo of our Medical Sieve Cognitive Assistant Application here.

Curious: How would you specify the exclusions of information? So that you could replicate the “filtered” view of the data?

Replication is a major issue in publicly funded research these days. Not reason for that to be any different for data science.

Yes?

May 16, 2015

The tensor renaissance in data science

Filed under: Data Science,Mathematics,Tensors — Patrick Durusau @ 8:02 pm

The tensor renaissance in data science by Ben Lorica.

From the post:

After sitting in on UC Irvine Professor Anima Anandkumar’s Strata + Hadoop World 2015 in San Jose presentation, I wrote a post urging the data community to build tensor decomposition libraries for data science. The feedback I’ve gotten from readers has been extremely positive. During the latest episode of the O’Reilly Data Show Podcast, I sat down with Anandkumar to talk about tensor decomposition, machine learning, and the data science program at UC Irvine.

Modeling higher-order relationships

The natural question is: why use tensors when (large) matrices can already be challenging to work with? Proponents are quick to point out that tensors can model more complex relationships. Anandkumar explains:

Tensors are higher order generalizations of matrices. While matrices are two-dimensional arrays consisting of rows and columns, tensors are now multi-dimensional arrays. … For instance, you can picture tensors as a three-dimensional cube. In fact, I have here on my desk a Rubik’s Cube, and sometimes I use it to get a better understanding when I think about tensors. … One of the biggest use of tensors is for representing higher order relationships. … If you want to only represent pair-wise relationships, say co-occurrence of every pair of words in a set of documents, then a matrix suffices. On the other hand, if you want to learn the probability of a range of triplets of words, then we need a tensor to record such relationships. These kinds of higher order relationships are not only important for text, but also, say, for social network analysis. You want to learn not only about who is immediate friends with whom, but, say, who is friends of friends of friends of someone, and so on. Tensors, as a whole, can represent much richer data structures than matrices.

The passage:

…who is friends of friends of friends of someone, and so on. Tensors, as a whole, can represent much richer data structures than matrices.

caught my attention.

The same could be said about other data structures, such as graphs.

I mention graphs because data representations carry assumptions and limitations that aren’t labeled for casual users. Such as directed acyclic graphs not supporting the representation of husband-wife relationships.

BTW, the Wikipedia entry on tensors has this introduction to defining tensor:

There are several approaches to defining tensors. Although seemingly different, the approaches just describe the same geometric concept using different languages and at different levels of abstraction.

Wonder if there is a mapping between the components of the different approaches?

Suggestions of other tensor resources appreciated!

April 17, 2015

Data Elixir

Filed under: Data Science — Patrick Durusau @ 6:30 pm

Data Elixir

From the webpage:

Data Elixir is a weekly collection of the best data science news, resources, and inspirations from around the web.

Subscribe now for free and never miss an issue.

Resources like this one help with winnowing the chaff in IT.

I first saw this in a tweet by Lon Riesberg.

April 16, 2015

clojure-datascience (Immutability for Auditing)

Filed under: Clojure,Data Science — Patrick Durusau @ 5:56 pm

clojure-datascience

From the webpage:

Resources for the budding Clojure Data Scientist.

Lots of opportunities for contributions!

It occurs to me that immutability is a prerequisite for auditing.

Yes?

If I were the SEC, as in the U.S. Securities and Exchange Commission, and NOT the SEC, as in the Southeastern Conference (sports), I would make immutability a requirement for data systems in the finance industry.

Any mutable change would be presumptive evidence of fraud.

That would certainly create a lot of jobs in the financial sector for functional programmers. And jailers as well considering the history of the finance industry.

March 30, 2015

The Field Guide to Data Science

Filed under: Data Science — Patrick Durusau @ 9:00 am

The Field Guide to Data Science by Booz Allen Hamilton.

From “The Story of the Field Guide:”

While there are countless industry and academic publications describing what Data Science is and why we should care, little information is available to explain how to make use of data as a resource. At Booz Allen, we built an industry-leading team of Data Scientists. Over the course of hundreds of analytic challenges for dozens of clients, we’ve unraveled the DNA of Data Science. We mapped the Data Science DNA to unravel the what, the why, the who and the how.

Many people have put forth their thoughts on single aspects of Data Science. We believe we can offer a broad perspective on the conceptual models, tradecraft, processes and culture of Data Science. Companies with strong Data Science teams often focus
on a single class of problems – graph algorithms for social network analysis and recommender models for online shopping are two notable examples. Booz Allen is different. In our role as consultants, we support a diverse set of clients across a variety of domains. This allows us to uniquely understand the DNA of Data Science. Our goal in creating The Field Guide to Data Science is to capture what we have learned and to share it broadly. We want this effort to help drive forward the science and art of Data Science.

This is a great example of what can be done with authors, professional editors and graphic artists putting together a publication.

While it is just a “field guide,” it has enough depth to use it as a starting point for exploring data science projects.

Imagine that you have senior staff who have read and have a grasp of the field guide. I can easily imagine taking the appropriate parts of the field guide to serve as “windows” onto further steps for a particular project. Which would enable senior staff to remain grounded in what they understand and how further steps related back to that understanding. Overall I think this is an excellent field guide/introduction to data science.

BTW, the “Analytic Connection in the Data Lake” graphic on page 28 is similar to topic maps pointing into an infoverse.

I first saw this in a tweet by Kirk Borne.

Enjoy!

March 18, 2015

Open Source Tensor Libraries For Data Science

Filed under: Data Science,Mathematics,Open Source,Programming — Patrick Durusau @ 5:20 pm

Let’s build open source tensor libraries for data science by Ben Lorica.

From the post:

Data scientists frequently find themselves dealing with high-dimensional feature spaces. As an example, text mining usually involves vocabularies comprised of 10,000+ different words. Many analytic problems involve linear algebra, particularly 2D matrix factorization techniques, for which several open source implementations are available. Anyone working on implementing machine learning algorithms ends up needing a good library for matrix analysis and operations.

But why stop at 2D representations? In a recent Strata + Hadoop World San Jose presentation, UC Irvine professor Anima Anandkumar described how techniques developed for higher-dimensional arrays can be applied to machine learning. Tensors are generalizations of matrices that let you look beyond pairwise relationships to higher-dimensional models (a matrix is a second-order tensor). For instance, one can examine patterns between any three (or more) dimensions in data sets. In a text mining application, this leads to models that incorporate the co-occurrence of three or more words, and in social networks, you can use tensors to encode arbitrary degrees of influence (e.g., “friend of friend of friend” of a user).

In case you are interested, Wikipedia has a list of software packages for tensor analaysis.

Not mentioned by Wikipedia: Facebook open sourcing TH++ last year, a library for tensor analysis. Along with fblualibz, which includes a bridge between Python and Lua (for running tensor analysis).

Uni10 wasn’t mentioned by Wikipedia either.

Good starting place: Big Tensor Mining, Carnegie Mellon Database Group.

Suggest you join an existing effort before you start duplicating existing work.

March 14, 2015

Hacking Academia: Data Science and the University

Filed under: Data Science,Education — Patrick Durusau @ 6:44 pm

Hacking Academia: Data Science and the University by Jake Vanderplas

From the post:

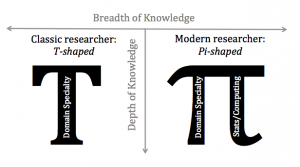
In the words of Alex Szalay, these sorts of researchers must be “Pi-shaped” as opposed to the more traditional “T-shaped” researcher. In Szalay’s view, a classic PhD program generates T-shaped researchers: scientists with wide-but-shallow general knowledge, but deep skill and expertise in one particular area. The new breed of scientific researchers, the data scientists, must be Pi-shaped: that is, they maintain the same wide breadth, but push deeper both in their own subject area and in the statistical or computational methods that help drive modern research:

pi_shaped

Perhaps neither of these labels or descriptions is quite right. Another school of thought on data science is Jim Gray’s idea of the “Fourth Paradigm” of scientific discovery: First came the observational insights of empirical science; second were the mathematically-driven insights of theoretical science; third were the simulation-driven insights of computational science. The fourth paradigm involves primarily data-driven insights of modern scientific research. Perhaps just as the scientific method morphed and grew through each of the previous paradigmatic transitions, so should the scientific method across all disciplines be modified again for this new data-driven realm of knowledge.

Neither one of the labels in the graphic are correct. In part because this a classic light versus dark dualism, along the lines of Middle Age scholars making reference to the dark ages. You could not have asked anyone living between the 6th and 13th centuries, what it felt like to live in the “dark ages.” That was a name later invented to distinguish the “dark ages,” an invention that came about in the “Middle Ages.” The “Middle Ages” being coined, of course, during the Renaissance.

Every age thinks it is superior to those that came before and the same is true for changes in the humanities and sciences. Fear not, someday your descendants will wonder how we fed ourselves, being hobbled with such vastly inferior software and hardware.

I mention this because the “Pi-shaped” graphic is making the rounds on Twitter. It is only one of any number of new “distinctions” that are springing up in academia and elsewhere. None of which will be of interest or perhaps even intelligible in another twenty years.

Rather than focusing on creating ephemeral labels for ourselves and others, how about we focus on research and results, whatever label has been attached to someone? Yes?

March 13, 2015

Building A Digital Future

Filed under: Computer Science,Data Science,Marketing — Patrick Durusau @ 7:06 pm

You may have missed BBC gives children mini-computers in Make it Digital scheme by Jane Wakefield.

From the post:

One million Micro Bits – a stripped-down computer similar to a Raspberry Pi – will be given to all pupils starting secondary school in the autumn term.

The BBC is also launching a season of coding-based programmes and activities.

It will include a new drama based on Grand Theft Auto and a documentary on Bletchley Park.

Digital visionaries

The initiative is part of a wider push to increase digital skills among young people and help to fill the digital skills gap.

The UK is facing a significant skills shortage, with 1.4 million “digital professionals” estimated to be needed over the next five years.

The BBC is joining a range of organisations including Microsoft, BT, Google, Code Club, TeenTech and Young Rewired State to address the shortfall.

At the launch of the Make it Digital initiative in London, director-general Tony Hall explained why the BBC was getting involved.

Isn’t that clever?

Odd that I haven’t heard about a similar effort in the United States.

There are only 15 million (14.6 million actually) secondary students this year in the United States and at $35 per Raspberry Pi, that’s only $525,000,000. That may sound like a lot but remember that the 2015 budget request for the Department of Homeland security is $38.2 Billion (yes, with a B). We are spending 64 times the amount needed to buy every secondary student in the United States a Raspberry Pi on DHS. A department that has yet to catch a single terrorist.

There would be consequences to buying every secondary student in the United States a Raspberry Pi:

  • Manufacturers of Raspberry Pi would have a revenue stream for more improvements
  • A vast secondary markets for add-ons for Raspberry Pi computers would be born
  • An even larger market for tutors and classes on Raspberry Pi would jump start
  • Millions of secondary students would be taking positive steps towards digital literacy

The only real drawback that I foresee is that the usual suspects would not be at the budget trough.

Maybe, just this once, the importance of digital literacy and inspiring a new generation of CS researchers is worth taking that hit.

Any school districts distributing Raspberry Pis on their own to set an example for the feds?

PS: I would avoid getting drawn into “accountability” debates. Some students will profit from them, some won’t. The important aspect is development of an ongoing principle of digital literacy and supporting it. Not every child reads books from the library but every community is poorer for the lack of a well supported library.

I first saw this in a tweet by Bart Hannsens.

March 10, 2015

MIT Group Cites “Data Prep” as a Data Science Bottleneck

Filed under: Data Science,ETL,Topic Maps — Patrick Durusau @ 7:38 pm

MIT Group Cites “Data Prep” as a Data Science Bottleneck

The bottleneck is varying data semantics. No stranger to anyone interested in topic maps. The traditional means of solving that problem is to clean the data for one purpose, which unless the basis for cleaning is recorded, leaves the data dirty for the next round of integration.

What do you think is being described in this text?:

Much of Veeramachaneni’s recent research has focused on how to automate this lengthy data prep process. “Data scientists go to all these boot camps in Silicon Valley to learn open source big data software like Hadoop, and they come back, and say ‘Great, but we’re still stuck with the problem of getting the raw data to a place where we can use all these tools,’” Veeramachaneni says.

The proliferation of data sources and the time it takes to prepare these massive reserves of data are the core problems Tamr is attacking. The knee-jerk reaction to this next-gen integration and preparation problem tends to be “Machine Learning” — a cure for all ills. But as Veeramachaneni points out, machine learning can’t resolve all data inconsistencies:

Veeramachaneni and his team are also exploring how to efficiently integrate the expertise of domain experts, “so it won’t take up too much of their time,” he says. “Our biggest challenge is how to use human input efficiently, and how to make the interactions seamless and efficient. What sort of collaborative frameworks and mechanisms can we build to increase the pool of people who participate?”

Tamr has built the very sort of collaborative framework Veeramachaneni mentions, drawing from the best of machine and human learning to connect hundreds or thousands of data sources.

Top-down, deterministic data unification approaches (such as ETL, ELT and MDM) were not designed to scale to the variety of hundreds or thousands or even tens of thousands of data silos (perpetual and proliferating). Traditional deterministic systems depend on a highly trained architect developing a “master” schema — “the one schema to rule them all” — which we believe is a red herring. Embracing the fundamental diversity and ever-changing nature of enterprise data and semantics leads you towards a bottom up, probabalistic approach to connecting data sources from various enterprise silos.

You also have to engage the source owners collaboratively to curate the variety of data at scale, which is Tamr’s core design pattern. Advanced algorithms automatically connect the vast majority of the sources while resolving duplications, errors and inconsistencies among source data of sources, attributes and records — a bottom-up, probabilistic solution that is reminiscent of Google’s full-scale approach to web search and connection. When the Tamr system can’t resolve connections automatically, it calls for human expert guidance, using people in the organization familiar with the data to weigh in on the mapping and improve its quality and integrity.

Off hand I would say it is a topic map authoring solution that features algorithms to assist the authors where authoring has been crowd-sourced.

What I don’t know is whether the insight of experts is captured as dark data (A matches B) or if their identifications are preserved so they can be re-used in the future (The properties of A that result in a match with the properties of B).

I didn’t register to I can’t see the “white paper.” Let me know how close I came if you decide to get the “white paper.” Scientists are donating research data in the name of open science but startups are still farming registration data.

How to Speak Data Science

Filed under: Data Science,Humor — Patrick Durusau @ 2:49 pm

How to Speak Data Science by DataCamp.

One of my personal favorites:

“We booked these results with a small sample” – Our financial budget wasn’t large enough to perform a statistical significant data analysis.

See: Use of SurveyMonkey by mid-level managers. Managers without a clue on survey construction, testing, validation, much less data analysis of the results.

Others that DataCamp missed?

March 8, 2015

The Open-Source Data Science Masters

Filed under: Data Science,Education — Patrick Durusau @ 7:05 pm

The Open-Source Data Science Masters by Clare Corthell.

Clare recites all the numbing stats on the coming shortage of data scientists but then takes a turn that most don’t.

Clare outlines a masters of data science curriculum using free resources for the most part on the Web.

Will you help reduce the coming shortage of data scientists?

March 3, 2015

Top 50 Data Science Resources:

Filed under: Data Science — Patrick Durusau @ 6:33 pm

Top 50 Data Science Resources: The Best Blogs, Forums, Videos and Tutorials to Learn All about Data Science

From the webpage:

The field of data science is constantly evolving and ever-advancing, with new technologies placing more valuable insights in the hands of modern enterprises. More data-driven organizations are hiring data scientists to drive their efforts to gather, analyze, and make use of Big Data in valuable ways.

Because the field of data science is so broad and sometimes challenging to navigate, we’ve compiled a list of 50 of the most helpful data science resources on the web. Whether you’re a student or new professional working in the field of data science, these resources are valuable for discovering the latest employment opportunities, finding tutorials for the processes and systems you’re using on a daily basis, learning hacks and tricks to boost your performance, and connecting with other professionals in your field.

Note: The following 50 resources are not ranked or rated in order of importance or value; rather, they are categorized to make it easy for you to locate the resources you need most. Click through to a specific category using the links in the Table of Contents below.

A useful list as far as it goes but like all such lists, it probably has resources you have already seen. And the next person who thinks a list of data science resources is a great idea will make yet another list.

I suspect for web based resources, we can do a fair job at deduping lists of resources but how do we create incentives to seek out or make more visible all the existing lists? And of course having done that, how do we create incentives to combine those list together?

So far as I can tell, the nature and extent of incentives for such collaboration are either unknown or unpracticed. I’m betting on unknown. Thoughts on how to explore possible incentives? The worst we can do is remain with the status quo.

I first saw this in a tweet by Marcelo Domínguez.

ComputerWorld’s R for Beginners Hands-On Guide

Filed under: Data Science,R — Patrick Durusau @ 4:18 pm

ComputerWorld’s R for Beginners Hands-On Guide by David Smith.

From the post:

Computerworld’s Sharon Machlis has done a great service for the R community — and R especially novices — by creating the on-line Beginner’s Guide to R. You can read our overview of her guide from 2013 here, but it’s been regularly updated since then.

Now available in PDF format!

David also suggests that R beginners check out beginner’s tips for R from the Revolutions archive.

If you are using R, the Revolutions blog is on your browser toolbar. If you are learning R, the Revolutions blog should be on your browser toolbar.

February 22, 2015

Unleashing the Power of Data to Serve the American People

Filed under: Data Science,Government,Government Data,Politics — Patrick Durusau @ 11:56 am

Unleashing the Power of Data to Serve the American People by Dr. DJ Patil.

You can read (and listen) to Patil’s high level goals as the first ever U.S. Chief Data Scientist at his post.

His goals are too abstract and general to attract meaningful disagreement and that isn’t the purpose of this post.

I posted the link to his comments to urge you to contact Patil (or rather his office) with concrete plans for how his office can assist you in finding and using data. The sooner the better.

No doubt some areas are already off-limits for improved data access and some priorities are already set.

That said, contacting Patil before he and his new office have solidified in place can play an important role in establishing the scope of his office. On a lesser scale, the same situation that confronted George Washington as the first U.S. President. Nothing was set in stone and every act established a precedent for those who came after him.

Now is the time to press for an expansive and far reaching role for the U.S. Chief Data Scientist within the federal bureaucracy.

February 18, 2015

The Revolution in Astronomy Education: Data Science for the Masses

Filed under: Astroinformatics,Data Science,Education — Patrick Durusau @ 12:42 pm

The Revolution in Astronomy Education: Data Science for the Masses
by Kirk D. Borne, et al.

Abstract:

As our capacity to study ever-expanding domains of our science has increased (including the time domain, non-electromagnetic phenomena, magnetized plasmas, and numerous sky surveys in multiple wavebands with broad spatial coverage and unprecedented depths), so have the horizons of our understanding of the Universe been similarly expanding. This expansion is coupled to the exponential data deluge from multiple sky surveys, which have grown from gigabytes into terabytes during the past decade, and will grow from terabytes into Petabytes (even hundreds of Petabytes) in the next decade. With this increased vastness of information, there is a growing gap between our awareness of that information and our understanding of it. Training the next generation in the fine art of deriving intelligent understanding from data is needed for the success of sciences, communities, projects, agencies, businesses, and economies. This is true for both specialists (scientists) and non-specialists (everyone else: the public, educators and students, workforce). Specialists must learn and apply new data science research techniques in order to advance our understanding of the Universe. Non-specialists require information literacy skills as productive members of the 21st century workforce, integrating foundational skills for lifelong learning in a world increasingly dominated by data. We address the impact of the emerging discipline of data science on astronomy education within two contexts: formal education and lifelong learners.

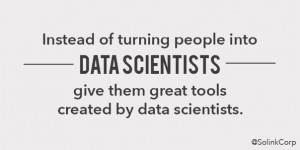
Kirk Borne posted a tweet today about this paper with following graphic:

turning-people

I deeply admire the work that Kirk has done, is doing and hopefully will continue to do, but is the answer really that simple? That is we need to provide people with “…great tools written by data scientists?”

As an example of what drives my uncertainty, I saw a presentation a number of years ago in biblical studies that involved statistical analysis and when the speaker was asked by a particular result was significant, the response was the manual said that it was. Ouch!

On the other hand, it may be that like automobiles, we have to accept a certain level of accidents/injuries/deaths as a cost of making such tools widely available.

Should we acknowledge up front that a certain level of mis-use, poor use, inappropriate use of “great tools written by data scientists” is a cost of making data and data tools available?

PS: I am leaving to one side cases where tools have been deliberately fashioned to reach false or incorrect results. Detecting those cases might challenge seasoned data scientists.

February 10, 2015

CrowdFlower 2015 DATA SCIENTIST REPORT

Filed under: Data Science — Patrick Durusau @ 8:12 pm

CrowdFlower 2015 DATA SCIENTIST REPORT (local copy). If you want to give up your email, go here.

Survey of one hundred and fifty-three (that’s what more than 150 means) data scientists. Still, the results don’t vary much from those I have seen cited elsewhere.

A couple of interested tidbits:

66.7% say cleaning and organizing data is one of their two most time-consuming tasks

Yet when you read the report, how many data scientists say that creation of cleaner, more organized data would make their lives easier?

Survey says:

#1 “to acquire all necessary tools to effectively do the job” (cited by 54.3 percent of respondents)

#2 “set clearer goals and objectives on projects” (cited by 52.3 percent of respondents).

#3 “invest more in training and development to help team members continually grow their capabilities” (cited by 47.7 percent of respondents)

Someone may have asked about cleaner and better organized data but it didn’t make the reported survey results.

Amazing yes? Over sixty-six (66) percent of their time spent cleaning data and no voiced desire to create cleaner data.

Maybe it was just these one hundred and fifty-three data scientists or perhaps the survey instrument.

Making it possible to reduce the amount of time you spend on janitorial work with data would be a priority for me.

You?

« Newer PostsOlder Posts »

Powered by WordPress