Another Word For It Patrick Durusau on Topic Maps and Semantic Diversity

June 21, 2012

Working with Graph Data from Neo4j in QlikView

Filed under: Business Intelligence,Graphs,Neo4j — Patrick Durusau @ 1:48 pm

Working with Graph Data from Neo4j in QlikView

From the post:

There are numerous examples of problems which can be handled efficiently by graph databases. A graph is made up of nodes and relationships between nodes (or vertices and edges): http://en.wikipedia.org/wiki/Graph_database

Now we can use graph data in a business intelligence / business discovery solution like QlikView to do some more business related analytics.

Neo4j is a high-performance, NoSQL graph database with all the features of a mature and robust database. It is an open source project supported by Neo Technology, implemented in Java. You can read more about it here: http://neo4j.org

Here are some slides about graph problems and use cases for Neo4j: http://www.slideshare.net/peterneubauer/neo4j-5-cool-graph-examples-4473985

Since the Neo4j JDBC driver is available we can use the QlikView JDBC Connector from TIQ Solutions and Cypher – a declarative graph query language – for expressive and efficient querying of the graph data. Take a look into the Cypher documentation to understand the syntax of this human query language, because it is totally different from SQL: http://docs.neo4j.org/chunked/1.7/cypher-query-lang.html

A very interesting presentation and it only requires your time to see the potential for benefits (or not) from using Neo4j and QlikView. (Some people who try the software may not benefit at all. It is as important to identify them quickly as it is those who will greatly benefit from it.)

It fails to make the case for business analytics, mostly because it doesn’t frame a business analytics problem and then solving it. Sorting movies by the average age of actors could be an answer to a BI question but which one isn’t readily apparent.
May 23, 2012

Forecasting: principles and practice

Filed under: Business Intelligence,Forecasting — Patrick Durusau @ 2:23 pm

Forecasting: principles and practice: An online textbook by Rob J Hyndman and George Athanasopoulos.

From the preface:

Wel­come to our new online text­book on fore­cast­ing. This book is intended as a replace­ment for Makri­dakis, Wheel­wright and Hyn­d­man (Wiley 1998).

The entire book is avail­able online and free-of-charge. Of course, we won’t make much money doing this, but text­books never make much money any­way — the pub­lish­ers make all the money. We’d rather cre­ate some­thing that is widely used and use­ful, than have large pub­lish­ers profit from our efforts.

Even­tu­ally a print ver­sion of the book will be avail­able to pur­chase on Ama­zon, but not until a few more chap­ters are written.

This text­book is intended to pro­vide a com­pre­hen­sive intro­duc­tion to fore­cast­ing meth­ods and present enough infor­ma­tion about each method for read­ers to use them sen­si­bly. We don’t attempt to give a thor­ough dis­cus­sion of the the­o­ret­i­cal details behind each method, although the ref­er­ences at the end of each chap­ter will fill in many of those details.

The book is writ­ten for three audi­ences: (1) people find­ing them­selves doing fore­cast­ing in busi­ness when they may not have had any for­mal train­ing in the area; (2) undergraduate stu­dents study­ing busi­ness; (3) MBA stu­dents doing a fore­cast­ing elec­tive. We use it our­selves for a second-year sub­ject for stu­dents under­tak­ing a Bach­e­lor of Com­merce degree at Monash Uni­ver­sity, Australia.

Should be a useful resource for learning the forecasting “lingo” in a business context. Or for learning forecasting for that matter.

The middle chapters on regression, as the authors point out, are unfinished by they hope to have the book complete by the end of 2012.

It could be a really nice gesture on our part if we all read a chapter or so and suggested corrections to improvements to the prose.

May 21, 2012

A Look At Google BigQuery

Filed under: Business Intelligence,Google BigQuery — Patrick Durusau @ 6:55 pm

A Look At Google BigQuery

Chris Webb writes:

Over the years I’ve written quite a few posts about Google’s BI capabilities. Google never seems to get mentioned much as a BI tools vendor but to me it’s clear that it’s doing a lot in this area and is consciously building up its capabilities; you only need to look at things like Fusion Tables (check out these recently-added features), Google Refine and of course Google Docs to see that it’s pursuing a self-service, information-worker-led vision of BI that’s very similar to the one that Microsoft is pursuing with PowerPivot and Data Explorer.

Earlier this month Google announced the launch of BigQuery and I decided to take a look. Why would a Microsoft BI loyalist like me want to do this, you ask? Well, there are a number of reasons:

Looks like an even handed report to me.

See what you think about it and BigQuery.

April 17, 2012

Self-Service BI Mapping with Microsoft Research’s Layerscape–Part 1

Filed under: Business Intelligence,Layerscape — Patrick Durusau @ 7:11 pm

Self-Service BI Mapping with Microsoft Research’s Layerscape–Part 1 by Chris Webb.

From the post:

Sometimes you find a tool that is so cool, you can’t believe no-one else has picked up on it before. This is one of those times: a few month or so ago I came across a new tool called Layerscape (http://www.layerscape.org) from Microsoft Research which allows you to overlay data from Excel onto maps in Microsoft WorldWide Telescope (http://www.worldwidetelescope.org). “What is WorldWide Telescope?” I hear you ask – well, it’s basically Microsoft Research’s answer to Google Earth, although it’s not limited to the Earth in that it also contains images of the universe from a wide range of ground and space-based telescopes. It’s a pretty cool toy in its own right, but Layerscape – which seems to be aimed at academics, despite the obvious business uses – turns it into a pretty amazing BI visualisation tool.

Layerscape is very easy to use: it’s an Excel addin, and once you have it and WWT installed all you need to do is select a range of data in Excel to be able to visualise it in WWT. For some cool examples of what it can do, take a look at the videos posted on the Layerscape website like this one (Silverlight required): http://www.layerscape.org/Content/Index/384

Looks like I am going to be putting the latest version of Windows and Office on my Linux box.

Will applications like Layerscape raise the bar for BI products generally? Products for the intelligence community?


Update: Self-Service BI Mapping with Microsoft Research’s Layerscape–Part 2

Chris plots the weather data from the earlier post onto a map. I think it looks pretty good. Am concerned if the 150000 row limit Chris mentions are in Layerscape or in his hardware?

I may have to beef up the RAM in my Ubuntu box for the Windows/Office combination.

January 22, 2012

Combining Heterogeneous Classifiers for Relational Databases (Of Relational Prisons and such)

Filed under: Business Intelligence,Classifier,Database,Schema — Patrick Durusau @ 7:39 pm

Combining Heterogeneous Classifiers for Relational Databases by Geetha Manjunatha, M Narasimha Murty and Dinkar Sitaram.

Abstract:

Most enterprise data is distributed in multiple relational databases with expert-designed schema. Using traditional single-table machine learning techniques over such data not only incur a computational penalty for converting to a ‘flat’ form (mega-join), even the human-specified semantic information present in the relations is lost. In this paper, we present a practical, two-phase hierarchical meta-classification algorithm for relational databases with a semantic divide and conquer approach. We propose a recursive, prediction aggregation technique over heterogeneous classifiers applied on individual database tables. The proposed algorithm was evaluated on three diverse datasets, namely TPCH, PKDD and UCI benchmarks and showed considerable reduction in classification time without any loss of prediction accuracy.

When I read:

So, a typical enterprise dataset resides in such expert-designed multiple relational database tables. On the other hand, as known, most traditional classi cation algorithms still assume that the input dataset is available in a single table – a flat representation of data attributes. So, for applying these state-of-art single-table data mining techniques to enterprise data, one needs to convert the distributed relational data into a flat form.

a couple of things dropped into place.

First, the problem being described, the production of a flat form for analysis reminds me of the problem of record linkage in the late 1950’s (predating relational databases). There records were regularized to enable very similar analysis.

Second, as the authors state in a paragraph or so, conversion to such a format is not possible in most cases. Interesting that the choice of relational database table design has the impact of limiting the type of analysis that can be performed on the data.

Therefore, knowledge mining over real enterprise data using machine learning techniques is very valuable for what is called an intelligent enterprise. However, application of state-of-art pattern recognition techniques in the mainstream BI has not yet taken o [Gartner report] due to lack of in-memory analytics among others. The key hurdle to make this possible is the incompatibility between the input data formats used by most machine learning techniques and the formats used by real enterprises.

If freeing data from its relational prison is a key aspect to empowering business intelligence (BI), what would you suggest as a solution?

January 18, 2012

BI’s Dirty Secrets – Why Business People are Addicted to Spreadsheets

Filed under: Business Intelligence,Marketing,Spreadsheets — Patrick Durusau @ 7:51 pm

BI’s Dirty Secrets – Why Business People are Addicted to Spreadsheets by Rick Sherman.

SecretMicrosoft Excel spreadsheets are the top BI tool of choice. That choking sound you hear is vendors and IT people reacting viscerally when they confront this fact. Their responses include:

  • Business people are averse to change; they don’t want to invest time in learning a new tool
  • Business people don’t understand that BI tools such as dashboards are more powerful than spreadsheets; they’re foolish not to use them
  • Spreadsheets are filled with errors
  • Spreadsheets are from hell

IDC estimated that the worldwide spend on business analytics in 2011 was $90 billion. Studies have found that many firms have more than one BI tool in use, and often more than six BI tools. Yet a recent study found that enterprises have been “stuck” at about a 25% adoption rate of BI tools by business people for a few years.

So why have adoption rates flatlined in enterprises that have had these tools for a while? Are the pundits correct in saying that business people are averse to change, lazy or just ignorant of how wonderful BI tools are?

The answers are very different if you put yourself in the business person’s position.

Read Rick’s blog to see what business people think about changing from spreadsheets.

Have you ever heard the saying: If you can’t lick ’em, join ’em?

There have been a number of presentations/papers on going from spreadsheets to XTM topic maps.

I don’t recall any papers that address adding topic map capabilities to spreadsheets. Do you?

Seems to me the question is:

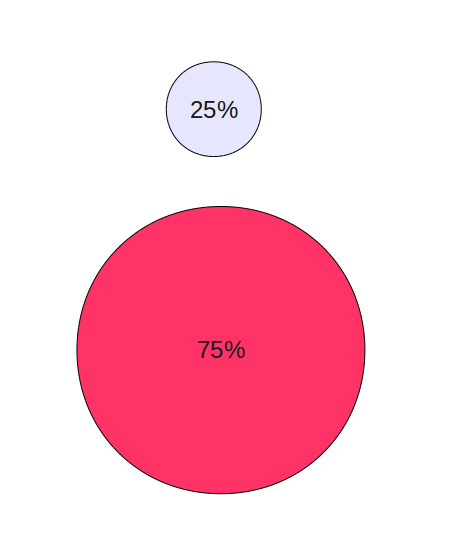
Should topic maps try for a percentage of the 25% slice of the BI pie (against other competing tools) or, try for a percentage of the 75% of the BI pie owed by spreadsheets?

To avoid the dreaded pie chart, I make images of the respective market shares, one three times the size of the other:

BI Market Shares

Question: If you could only have 3% of a market, which market would you pick?*

See, you are on your way to being a topic map maven and a successful entrepreneur.


* Any resemblance to a question on any MBA exam is purely coincidental.

January 17, 2012

November 9, 2011

B2B Blog Strategy | Ten Be’s of The Best B2B Blogs

Filed under: Business Intelligence,Marketing,Topic Maps — Patrick Durusau @ 7:43 pm

B2B Blog Strategy | Ten Be’s of The Best B2B Blogs

Joel York writes:

Blogging is one of the easiest, cheapest and most effective ways to engage the New Breed of B2B Buyer, yet so many B2B blogs miss the mark. Here are ten “be’s” of the best b2b blogs. It isn’t the first top ten list of best B2B blog secrets, and no doubt it will not be the last. But, it is mine and it’s what I personally strive for Chaotic Flow to be.

Joel’s advice will work for topic map blogs as well.

People are not going to find out about topic maps unless we continue to push information about topic maps out into the infosphere. Blogging is one aspect of pushing information. Tweeting is another. Publication of white papers, software and other materials is another.

The need for auditable, repeatable, reliable consolidation (if you don’t like the merging word) of information from different sources is only growing with the availability of more data on the Internet. I think topic maps has a role to play there. Do you?

Connecting the Dots: An Introduction

Filed under: Business Intelligence,Data Management,Data Models — Patrick Durusau @ 7:43 pm

Connecting the Dots: An Introduction

A new series of posts by Rick Sherman who writes:

In the real world the situations I discuss or encounter in enterprise BI, data warehousing and MDM implementations lead me to the conclusion that many enterprises simply do not connect the dots. These implementations potentially involve various disciplines such as data modeling, business and data requirements gathering, data profiling, data integration, data architecture, technical architecture, BI design, data governance, master data management (MDM) and predictive analytics. Although many BI project teams have experience in each of these disciplines they’re not applying the knowledge from one discipline to another.

The result is knowledge silos where the the best practices and experience from one discipline is not applied in the other disciplines.

The impact is a loss in productivity for all, higher long-term costs and poorly constructed solutions. This often results in solutions that are difficult to change as the business changes, don’t scale as the data volumes or numbers of uses increase, or is costly to maintain and operate.

Imagine that, knowledge silos in the practice of eliminating knowledge silos.

I suspect that reflects the reality that each of us is a model of a knowledge silo. There are areas we like better than others, areas we know better than others, areas where we simply don’t have the time to learn. But when asked for an answer to our part of a project, we have to have some answer, so we give the one we know. Hard to imagine us doing otherwise.

We can try to offset that natural tendency by reading broadly, looking for new areas or opportunities to learn new techniques, or at least have team members or consultants who make a practice out of surveying knowledge techniques broadly.

Rick promises to show how data modeling is disconnected from the other BI disciplines in the next Connecting the Dots post.

Tiny Trilogy

Filed under: Business Intelligence,Data Warehouse — Patrick Durusau @ 7:43 pm

Tiny Trilogy

Peter Thomas writes:

Although tinyurl.com was a pioneer in URL shortening, it seems to have been overtaken by a host of competing services. For example I tend to use bit.ly most of the time. However I still rather like the tinyurl.com option to create your own bespoke shortened URLs.

This feature rather came into its own recently when I was looking for a concise way to share my recent trilogy focusing on the use of historical data to justify BI/DW investments in Insurance.

Good series of posts on historical data and business intelligence. I suspect many of these lessons could be applied fairly directly to using historical data to justify semantic integration projects.

Such as showing what sharing would have meant as far as information on terrorists prior to 9/11.

Microsoft Business Intelligence (BI) Resources

Filed under: Business Intelligence,Microsoft — Patrick Durusau @ 7:42 pm

Microsoft Business Intelligence (BI) Resources

Dan English posts a number of MS BI resources from a PowerView session.

I don’t have access to an MS Server environment so you will have to evaluate these resources on your own.

For historical reasons I have mostly worked in *nix server environments. I have never really been tempted to experiment with MS server products, although I must confess I have had my share of laptops/desktops that ran Windows software. (I have *nix and Windows boxes sharing monitors/keyboard even now.)

With hardware prices where they are, perhaps I should setup a Windows server box (behind my firewall, etc.) so I can test some of these applications.

Wondering what it would take to put subject identity tests, a semantic shim as it were on top of these products to offer some enhanced value to their users? True enough, if popular MS would absorb it in a future release but isn’t that what progress is about?

November 7, 2011

The future of information workers according to Microsoft, and BI plays a big part

Filed under: Business Intelligence,Information Workers — Patrick Durusau @ 7:28 pm

The future of information workers according to Microsoft, and BI plays a big part by Kasper de Jonge.

New video from Microsoft about a possible IT future.

Does it have a Futurama (New York World’s Fair) sense to you?

Futurama was an exhibition at the 1939 World’s Fair. To get a sense of the exhibit, view: To New Horizons (1940)

Running time is almost 23 minutes and it takes almost a third of that to get to the Futurama part. A vision of what 1960 will look like.

Watch the MS video and then the other.

Discussion questions:

  • How near/far from the future is the MS video?
  • What semantic impedances need to be reduced for such a future? (people to people, people to data (searching), machine to machine)
  • Which ones first?

September 6, 2011

SmartData Collective

Filed under: Business Intelligence,Data Management — Patrick Durusau @ 7:16 pm

SmartData Collective

From the about page:

SmartData Collective, an online community moderated by Social Media Today, provides enterprise leaders access to the latest trends in Business Intelligence and Data Management. Our innovative model serves as a platform for recognized, global experts to share their insights through peer contributions, custom content publishing and alignment with industry leaders. SmartData Collective is a key resource for executives who need to make informed data management decisions.

Maybe a bit more mainstream than what you are accustomed to but think of it as a cross-cultural experience. 😉

Seriously, effective promotion of topic maps means pitching them as solving problems as seen by others, not ourselves.

« Newer Posts

Powered by WordPress