Another Word For It Patrick Durusau on Topic Maps and Semantic Diversity

January 21, 2015

How to share data with a statistician

Filed under: Open Data,Statistics — Patrick Durusau @ 7:38 pm

How to share data with a statistician by Robert M. Horton.

From the webpage:

This is a guide for anyone who needs to share data with a statistician. The target audiences I have in mind are:

  • Scientific collaborators who need statisticians to analyze data for them
  • Students or postdocs in scientific disciplines looking for consulting advice
  • Junior statistics students whose job it is to collate/clean data sets

The goals of this guide are to provide some instruction on the best way to share data to avoid the most common pitfalls and sources of delay in the transition from data collection to data analysis. The Leek group works with a large number of collaborators and the number one source of variation in the speed to results is the status of the data when they arrive at the Leek group. Based on my conversations with other statisticians this is true nearly universally.

My strong feeling is that statisticians should be able to handle the data in whatever state they arrive. It is important to see the raw data, understand the steps in the processing pipeline, and be able to incorporate hidden sources of variability in one’s data analysis. On the other hand, for many data types, the processing steps are well documented and standardized. So the work of converting the data from raw form to directly analyzable form can be performed before calling on a statistician. This can dramatically speed the turnaround time, since the statistician doesn’t have to work through all the pre-processing steps first.

My favorite part:

The code book

For almost any data set, the measurements you calculate will need to be described in more detail than you will sneak into the spreadsheet. The code book contains this information. At minimum it should contain:

  1. Information about the variables (including units!) in the data set not contained in the tidy data
  2. Information about the summary choices you made
  3. Information about the experimental study design you used

Does a codebook exist for the data that goes into or emerges from your data processing?

If someone has to ask you what variables mean, it’s not really “open” data is it?

I first saw this in a tweet by Christophe Lalanne.

January 14, 2015

Top 77 R posts for 2014 (+R jobs)

Filed under: Programming,R,Statistics — Patrick Durusau @ 4:48 pm

Top 77 R posts for 2014 (+R jobs) by Tal Galili.

From the post:

The site R-bloggers.com is now 5 years old. It strives to be an (unofficial) online journal of the R statistical programming environment, written by bloggers who agreed to contribute their R articles to the site, to be read by the R community.

So, how reliable is this list of the top 77?

This year, the site was visited by 2.7 million users, in 7 million sessions with 11.6 million pageviews. People have surfed the site from over 230 countries, with the greatest number of visitors coming from the United States (38%) and then followed by the United Kingdom (6.7%), Germany (5.5%), India( 5.1%), Canada (4%), France (2.9%), and other countries. 62% of the site’s visits came from returning users. R-bloggers has between 15,000 to 20,000 RSS/e-mail subscribers.

How’s that? A top whatever list based on actual numbers! Visits by public users.

I wonder if anyone has tried that on those click-bait webinars? You know the ones, where ad talk takes up more than 50% of the time and the balance is hand waving. That kind.

Enjoy the top 77 R post list! I will!

I first saw this in a tweet by Kirk Borne.

January 7, 2015

Non-Uniform Random Variate Generation

Filed under: Random Numbers,Statistics — Patrick Durusau @ 5:05 pm

Non-Uniform Random Variate Generation by Luc Devroye.

From the introduction:

Random number generatlon has Intrigued sclentlsts for a few decades, and a lot of effort has been spent on the creatlon of randomness on a determlnlstlc (non-random) machlne, that Is, on the deslgn of computer algorlthms that are able to produce “random” sequences of lntegers. Thls Is a dlfflcult task. Such algorlthms are called generators, and all generators have flaws because all of them construct the n -th number In the sequence In functlon of the n -1 numbers precedlng It, lnltlallzed wlth a nonrandom seed. Numerous quantltles have been lnvented over the years that measure Just how “random” a sequence Is, and most well-known generators have been subJected to rlgorous statlstlcal testlng. How-ever, for every generator, It ls always posslble to And a statlstlcal test of a (possl- bly odd) property to make the generator flunk. The mathernatlcal tools that are needed to deslgn and analyze these generators are largely number theoretlc and comblnatorlal. These tools differ drastically from those needed when we want to generate sequences of lntegers wlth certain non-unlform dlstrlbutlons, glven that a perfect unlform random number generator 1s avallable. The reader should be aware that we provlde hlm wlth only half the story (the second half). The assGmptlon that a perfect unlform random number generator 1s avallable 1s now qulte unreallstlc, but, wlth tlme, It should become less so. Havlng made the assumptlon, we can bulld qulte a powerful theory of non-unlform random varlate generatlon.

You will need random numbers for some purposes in information retrieval but that isn’t why I mention this eight hundred (800) + page tome.

The author has been good enough to put the entire work up on the Internet and you are free to use it for any purpose, even reselling it.

I mention it because in a recent podcast about Solr 5, the greatest emphasis was on building and managing Solr clusters. Which is a very important use case if you are indexing and searching “big data.”

But in the rush to index and search “big data,” to what extent are we ignoring the need to index and search Small But Important Data (SBID)?

This book would qualify as SBID and even better, it already has an index against which to judge your Solr indexing.

And there are other smallish collections of texts. The Michael Brown grand jury transcripts, which are < 5,000 pages, the CIA Torture Report at 6,000 pages, and many others. Texts that don’t qualify as “big data” but still require highly robust indexing capabilities.

Take Non-Uniform Random Variate Generation as a SBID and practice target for Solr.

I first saw this in a tweet by Computer Science.

January 3, 2015

Astrostatistics and Astroinformatics Portal (ASAIP)

Filed under: Astroinformatics,Science,Statistics — Patrick Durusau @ 7:35 pm

Astrostatistics and Astroinformatics Portal (ASAIP)

From the webpage:

The ASAIP provides searchable abstracts to Recent Papers in the field, several discussion Forums, various resources for researchers, brief Articles by experts, lists of Meetings, and access to various Web resources such as on-line courses, books, jobs and blogs. The site will be used for public outreach by five organizations: International Astrostatistics Association (IAA, to be affiliated with the International Statistical Institute), American Astronomical Society Working Group in Astroinformatics and Astrostatistics (AAS/WGAA), International Astronomical Union Working Group in Astrostatistics and Astroinformatics (IAU/WGAA), Information and Statistical Sciences Consortium of the planned Large Synoptic Survey Telescope (LSST/ISSC), and the American Statistical Association Interest Group in Astrostatistics (ASA/IGA).

Join the ASAIP! Members of ASAIP — researchers and students in astronomy, statistics, computer science and related fields — can contribute to the discussion Forums, submit Recent Papers, Research Group links, and announcements of Meetings. Members login using the box at the upper right; typical login names have the form `jsmith’. To become a member, please email the ASAIP editors.

Optical and radio astronomy had “big data” before “big data” was sexy! If you are looking for data sets to stretch your software, you are in the right place.

Enjoy!

December 22, 2014

RStatistics.Net (Beta)!

Filed under: R,Statistics — Patrick Durusau @ 4:11 pm

RStatistics.Net (Beta)!

From the webpage:

The No.1 Online Reference for all things related to R language and its applications in statistical computing.

This website is a R programming reference for beginners and advanced statisticians. Here, you will find data mining and machine learning techniques explained briefly with workable R code, which when used effectively can massively boost the predicting power of your analyses.

Who is this Website For?

  1. If you are a college student working on a project using R and you want to learn techniques to solve your problem
  2. If you are a statistician, but you don’t have prior programming experience, our plugin snippets of R Code will help you achieve several of your analysis outcomes in R
  3. If you are a programmer coming from other platform (such as python, SAS, SPSS) and you are looking to get your way around in R
  4. You have a software / DB background, and would like to expand your skills into data science and advanced analytics.
  5. You are a beginner with no stats background whatsoever, but have a critical analytical mind and have a keen interest in analytical problem solving.

Whatever your motivations, RStatistics.Net can help you achieve your goal.

Don’t Know Where To Get Started?

If you are completely new to R, the Getting-Started-Guide will walk you through the essentials of the language. The guide is structured in such a manner that the learning happens inquisitively in a direct and straightforward way. Some repetition may be needed for beginners before you get a overall feel and handle over the language. Reading and practicing the code snippets step-by-step will get you familiar and equip you to acquire higher level R modelling and algorithm-building skills.

What Will I Find Here ?

In the coming days, you will see top notch articles on techniques to learn and perform statistical analyses and problem solving in areas including but not bound to:

  1. Essential Stats
  2. Regression analysis
  3. Time Series Forecasting
  4. Cluster Analysis
  5. Machine Learning Algorithms
  6. Text Mining
  7. Social Media Analytics
  8. Classification Techniques
  9. Cool R Tips

Given the number of excellent resources on R that are online, any listing is likely to miss your favorite, I rather doubt the claim:

The No.1 Online Reference for all things related to R language and its applications in statistical computing.

for a beta site on R. 😉

Still, there is always room for one more reference site on R.

The practical exercises are “coming soon.”

This may already exist but a weekly tweet of an R problem with a data set could be handy.

December 19, 2014

A non-comprehensive list of awesome things other people did in 2014

Filed under: Data Analysis,Genomics,R,Statistics — Patrick Durusau @ 1:38 pm

A non-comprehensive list of awesome things other people did in 2014 by Jeff Leek.

Thirty-eight (38) top resources from 2014! Ranging from data analysis and statistics to R and genomics and places in between.

If you missed or overlooked any of these resources during 2014, take the time to correct that error!

Thanks Jeff!

I first saw this in a tweet by Nicholas Horton.

December 6, 2014

Introduction to statistical data analysis in Python.. (ATTN: Activists)

Filed under: Python,Statistics — Patrick Durusau @ 4:34 pm

Introduction to statistical data analysis in Python – frequentist and Bayesian methods by Cyrille Rossant.

Activists: I know, it really sounds more exciting than a hit from a crack pipe. Right? 😉

Seriously, consider this in light of: Activists Wield Search Data to Challenge and Change Police Policy. To cut to the chase, statistics proved that DWB stops (driving while black) resulted in searches of black men more than twice as often as white men but produced no more weapons/drugs. City of Durham changed its traffic stop policy. (I don’t know if DWB is now legal in Durham or not.)

But the point is that raw data and statistics can have an impact on a brighter than average city council. Doesn’t work every time but another tool to have at your disposal.

From the webpage:

In Chapter 7, Statistical Data Analysis, we introduce statistical methods for data analysis. In addition to covering statistical packages such as pandas, statsmodels, and PyMC, we explain the basics of the underlying mathematical principles. Therefore, this chapter will be most profitable if you have basic experience with probability theory and calculus.

The next chapter, Chapter 8, Machine Learning, is closely related; the underlying mathematics is very similar, but the goals are slightly different. While in the present chapter, we show how to gain insight into real-world data and how to make informed decisions in the presence of uncertainty, in the next chapter the goal is to learn from data, that is, to generalize and to predict outcomes from partial observations.

I first saw the Durham story in a tweet by Tim O’Reilly. The Python book was mentioned in a tweet by Scientific Python.

November 14, 2014

Seaborn: statistical data visualization (Python)

Filed under: Graphics,Statistics,Visualization — Patrick Durusau @ 8:21 pm

Seaborn: statistical data visualization

From the introduction:

Seaborn is a library for making attractive and informative statistical graphics in Python. It is built on top of matplotlib and tightly integrated with the PyData stack, including support for numpy and pandas data structures and statistical routines from scipy and statsmodels.

Some of the features that seaborn offers are

Seaborn aims to make visualization a central part of exploring and understanding data. The plotting functions operate on dataframes and arrays containing a whole dataset and internally perform the necessary aggregation and statistical model-fitting to produce informative plots. Seaborn’s goals are similar to those of R’s ggplot, but it takes a different approach with an imperative and object-oriented style that tries to make it straightforward to construct sophisticated plots. If matplotlib “tries to make easy things easy and hard things possible”, seaborn aims to make a well-defined set of hard things easy too.

From the “What’s New” page:

v0.5.0 (November 2014)

This is a major release from 0.4. Highlights include new functions for plotting heatmaps, possibly while applying clustering algorithms to discover structured relationships. These functions are complemented by new custom colormap functions and a full set of IPython widgets that allow interactive selection of colormap parameters. The palette tutorial has been rewritten to cover these new tools and more generally provide guidance on how to use color in visualizations. There are also a number of smaller changes and bugfixes.

The What’s New page has a more detailed listing of the improvements over 0.40.

If you haven’t seen Seaborn before, let me suggest that you view the tutorial on Visual Dataset Exploration.

You will be impressed. But if you aren’t, check yourself for a pulse. 😉

I first saw this in a tweet by Michael Waskom.

October 20, 2014

LSD Dimensions

Filed under: Linked Data,RDF,RDF Data Cube Vocabulary,Statistics — Patrick Durusau @ 7:50 pm

LSD Dimensions

From the about page: http://lsd-dimensions.org/dimensions

LSD Dimensions is an observatory of the current usage of dimensions and codes in Linked Statistical Data (LSD).

LSD Dimensions is an aggregator of all qb:DimensionProperty resources (and their associated triples), as defined in the RDF Data Cube vocabulary (W3C recommendation for publishing statistical data on the Web), that can be currently found in the Linked Data Cloud (read: the SPARQL endpoints in Datahub.io). Its purpose is to improve the reusability of statistical dimensions, codes and concept schemes in the Web of Data, providing an interface for users (future work: also for programs) to search for resources commonly used to describe open statistical datasets.

Usage

The main view shows the count of queried SPARQL endpoints and the number of retrieved dimensions, together with a table that displays these dimensions.

  • Sorting. Dimensions can be sorted by their dimension URI, label and number of references (i.e. number of times a dimension is used in the endpoints) by clicking on the column headers.
  • Pagination. The number of rows per page can be customized and browsed by clicking at the bottom selectors.
  • Search. String-based search can be performed by writing the search query in the top search field.

Any of these dimensions can be further explored by clicking at the eye icon on the left. The dimension detail view shows

  • Endpoints.. The endpoints that make use of that dimension.
  • Codes. Popular codes that are defined (future work: also assigned) as valid values for that dimension.

Motivation

RDF Data Cube (QB) has boosted the publication of Linked Statistical Data (LSD) as Linked Open Data (LOD) by providing a means “to publish multi-dimensional data, such as statistics, on the web in such a way that they can be linked to related data sets and concepts”. QB defines cubes as sets of observations affected by dimensions, measures and attributes. For example, the observation “the measured life expectancy of males in Newport in the period 2004-2006 is 76.7 years” has three dimensions (time period, with value 2004-2006; region, with value Newport; and sex, with value male), a measure (population life expectancy) and two attributes (the units of measure, years; and the metadata status, measured, to make explicit that the observation was measured instead of, for instance, estimated or interpolated). In some cases, it is useful to also define codes, a closed set of values taken by a dimension (e.g. sensible codes for the dimension sex could be male and female).

There is a vast diversity of domains to publish LSD about, and quite some dimensions and codes can be very heterogeneous, domain specific and hardly comparable. To this end, QB allows users to mint their own URIs to create arbitrary dimensions and associated codes. Conversely, some other dimensions and codes are quite common in statistics, and could be easily reused. However, publishers of LSD have no means to monitor the dimensions and codes currently used in other datasets published in QB as LOD, and consequently they cannot (a) link to them; nor (b) reuse them.

This is the motivation behind LSD Dimensions: it monitors the usage of existing dimensions and codes in LSD. It allows users to browse, search and gain insight into these dimensions and codes. We depict the diversity of statistical variables in LOD, improving their reusability.

(Emphasis added.)

The highlighted text:

There is a vast diversity of domains to publish LSD about, and quite some dimensions and codes can be very heterogeneous, domain specific and hardly comparable.

is the key isn’t it? If you can’t rely on data titles, users must examine the data and determine which sets can or should be compared.

The question then is how do you capture the information such users developed in making those decisions and pass it on to following users? Or do you just allow following users make their own way afresh?

If you document the additional information for each data set, by using a topic map, each use of this resource becomes richer for the following users. Richer or stays the same. Your call.

I first saw this in a tweet by Bob DuCharme. Who remarked this organization has a great title!

If you have made it this far, you realize that with all the data set, RDF and statistical language this isn’t the post you were looking for. 😉

PS: Yes Bob, it is a great title!
September 22, 2014

Algorithms and Data – Example

Filed under: Algorithms,Data,Statistics — Patrick Durusau @ 10:41 am

People's Climate

AJ+ was all over the #OurClimate march in New York City.

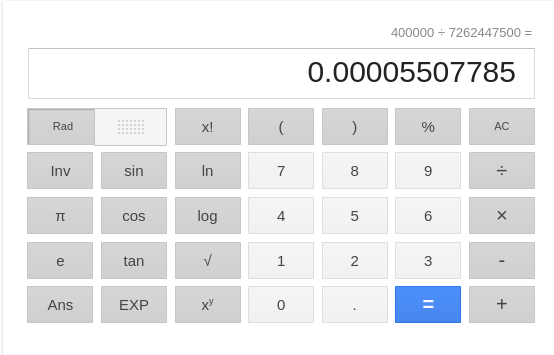
Let’s be generous and say the march attracted 400,000 people.

At approximately 10:16 AM Eastern time this morning, the world population clock reported a population of 7,262,447,500.

0.000550 % of the world’s population expressed an opinion on climate change in New York yesterday.

I mention that calculation, disclosing both data and the algorithm, to point out the distortion between the number of people driving policy versus the number of people impacted.

Other minority opinions promoted by AJ+ include that of the United States (population: 318,776,000) on what role Iran (population: 77,176,930) should play in the Middle East (population: 395,133,109) and the world (population: 7,262,447,500), on issues such as the Islamic State. BBC News: Islamic State crisis: Kerry says Iran can help defeat IS.

Isn’t that “the tail wagging the dog?”

Is there any wonder why international decision making departs from the common interests of the world’s population?

Hopefully AJ+ will stop beating the drum quite so loudly for minority opinions and seek out more representative ones, even if not conveniently located in New York City.

September 18, 2014

Common Sense and Statistics

Filed under: Machine Learning,Statistical Learning,Statistics — Patrick Durusau @ 7:02 pm

Common Sense and Statistics by John D. Cook.

From the post:

…, common sense is vitally important in statistics. Attempts to minimize the need for common sense can lead to nonsense. You need common sense to formulate a statistical model and to interpret inferences from that model. Statistics is a layer of exact calculation sandwiched between necessarily subjective formulation and interpretation. Even though common sense can go badly wrong with probability, it can also do quite well in some contexts. Common sense is necessary to map probability theory to applications and to evaluate how well that map works.

No matter how technical or complex analysis may appear, do not hesitate to ask for explanations if the data or results seem “off” to you. I witnessed a presentation several years ago when the manual for a statistics package was cited for the proposition that a result was significant.

I know you have never encountered that situation but you may know others who have.

Never fear asking questions about methods or results. Your colleagues are wondering the same things but are too afraid of appearing ignorant to ask questions.

Ignorance is curable. Willful ignorance is not.

If you aren’t already following John D. Cook, you should.

August 26, 2014

Test Your Analysis With Random Numbers

Filed under: Bioinformatics,Data Analysis,Statistics — Patrick Durusau @ 12:55 pm

A critical reanalysis of the relationship between genomics and well-being by Nicholas J. L. Brown, et al. (Nicholas J. L. Brown, doi: 10.1073/pnas.1407057111)

Abstract:

Fredrickson et al. [Fredrickson BL, et al. (2013) Proc Natl Acad Sci USA 110(33):13684–13689] claimed to have observed significant differences in gene expression related to hedonic and eudaimonic dimensions of well-being. Having closely examined both their claims and their data, we draw substantially different conclusions. After identifying some important conceptual and methodological flaws in their argument, we report the results of a series of reanalyses of their dataset. We first applied a variety of exploratory and confirmatory factor analysis techniques to their self-reported well-being data. A number of plausible factor solutions emerged, but none of these corresponded to Fredrickson et al.’s claimed hedonic and eudaimonic dimensions. We next examined the regression analyses that purportedly yielded distinct differential profiles of gene expression associated with the two well-being dimensions. Using the best-fitting two-factor solution that we identified, we obtained effects almost twice as large as those found by Fredrickson et al. using their questionable hedonic and eudaimonic factors. Next, we conducted regression analyses for all possible two-factor solutions of the psychometric data; we found that 69.2% of these gave statistically significant results for both factors, whereas only 0.25% would be expected to do so if the regression process was really able to identify independent differential gene expression effects. Finally, we replaced Fredrickson et al.’s psychometric data with random numbers and continued to find very large numbers of apparently statistically significant effects. We conclude that Fredrickson et al.’s widely publicized claims about the effects of different dimensions of well-being on health-related gene expression are merely artifacts of dubious analyses and erroneous methodology. (emphasis added)

To see the details you will need a subscription the the Proceedings of the National Academy of Sciences.

However, you can take this data analysis lesson from the abstract:

If your data can be replaced with random numbers and still yield statistically significant results, stop the publication process. Something is seriously wrong with your methodology.

I first saw this in a tweet by WvSchaik.

August 17, 2014

Bizarre Big Data Correlations

Filed under: BigData,Correlation,Humor,Statistics — Patrick Durusau @ 3:16 pm

Chance News 99 reported the following story:

The online lender ZestFinance Inc. found that people who fill out their loan applications using all capital letters default more often than people who use all lowercase letters, and more often still than people who use uppercase and lowercase letters correctly.

ZestFinance Chief Executive Douglas Merrill says the company looks at tens of thousands of signals when making a loan, and it doesn’t consider the capital-letter factor as significant as some other factors—such as income when linked with expenses and the local cost of living.

So while it may take capital letters into consideration when evaluating an application, it hasn’t held a loan up because of it.

Submitted by Paul Alper

If it weren’t an “online lender,” ZestFinance could take into account applications signed in crayon. 😉

Chance News collects stories with a statistical or probability angle. Some of them can be quite amusing.

August 13, 2014

Statistical Software

Filed under: Statistics — Patrick Durusau @ 2:00 pm

Statistical Software

A comparison of R, Matlab, SAS, Stata, and SPSS for their support of fifty-seven (57) statistical functions.

I have not verified the analysis but it is reported that R and Matlab support all fifty-seven (57), SAS supports forty-two (42), Stata supports twenty-nine (29) and SPSS supports a mere twenty (20).

Since R is open-source software, you can verify support of the statistical functions you need before looking at other software.

I first saw this at Table comparing the statistical capabilities of software packages by David Smith.

David mentions the table does not include Julia or Python. It also doesn’t include Mathematica. Having all of these compared in one table could be very useful. Sing out if you see such a table. Thanks!

August 6, 2014

datamash

Filed under: Datamash,Statistics — Patrick Durusau @ 1:24 pm

GNU datamash

From the homepage:

GNU datamash is a command-line program which performs basic numeric,textual and statistical operations on input textual data files.

To which you then reasonably ask: What basic numeric, textual and statistical operations?

From the manual:

File operations: transpose, reverse

Numeric operations: sum, min, max, absmin, absmax

Textual/Numeric operations: count, first, last, rand, unique, collapse, countunique

Statistical operations: mean, median, q1, q3, iqr, mode, antimode, pstdev, sstdev, pvar, svar, mad, madraw, sskew, pskew, skurt, pkurt, jarque, dpo

The default column separator is TAB but another character can be substituted for TAB.

Looks like a great utility to have in your data mining toolbox.

I first saw this in a tweet by Joe Pickrell.

August 2, 2014

Data Science Master

Open Source Data Science Master – The Plan by Fras and Sabine.

From the post:

Free!! education platforms have put some of the world’s most prestigious courses online in the last few years. This is our plan to use these and create our own custom open source data science Master.

Free online courses are selected to cover: Data Manipulation, Machine Learning & Algorithms, Programming, Statistics, and Visualization.

Be sure to take know of the pre-requisites the authors completed before embarking on their course work.

No particular project component is suggested because the course work will suggest ideas.

What other choices would you suggest? Either for broader basics or specialization?

July 25, 2014

Advanced Data Analysis from an Elementary Point of View (update)

Filed under: Data Analysis,Mathematics,Statistics — Patrick Durusau @ 3:37 pm

Advanced Data Analysis from an Elementary Point of View by Cosma Rohilla Shalizi. (8 January 2014)

From the introduction:

These are the notes for 36-402, Advanced Data Analysis, at Carnegie Mellon. If you are not enrolled in the class, you should know that it’s the methodological capstone of the core statistics sequence taken by our undergraduate majors (usually in their third year), and by students from a range of other departments. By this point, they have taken classes in introductory statistics and data analysis, probability theory, mathematical statistics, and modern linear regression (“401”). This class does not presume that you have learned but forgotten the material from the pre-requisites; it presumes that you know that material and can go beyond it. The class also presumes a firm grasp on linear algebra and multivariable calculus, and that you can read and write simple functions in R. If you are lacking in any of these areas, now would be an excellent time to leave.

I last reported on this draft in 2012 at: Advanced Data Analysis from an Elementary Point of View

Looking forward to this works publication by Cambridge University Press.

I first saw this in a tweet by Mark Patterson.

July 7, 2014

Access vs. Understanding

Filed under: Open Data,Public Data,Statistics — Patrick Durusau @ 4:09 pm

In Do doctors understand test results? William Kremer covers Risk savvy : how to make good decisions, a recent book on understanding risk statistics by Gerd Gigerenzer.

You will have little doubt that doctors don’t know the correct risk statistics for very common medical issues (breast cancer screening) and even when supplied with the correct information, they are incapable of interpreting it correctly when you finish Kermer’s article.

And the public?

Unsurprisingly, patients’ misconceptions about health risks are even further off the mark than doctors’. Gigerenzer and his colleagues asked over 10,000 men and women across Europe about the benefits of PSA screening and breast cancer screening respectively. Most overestimated the benefits, with respondents in the UK doing particularly badly – 99% of British men and 96% of British women overestimated the benefit of the tests. (Russians did the best, though Gigerenzer speculates that this is not because they get more good information, but because they get less misleading information.)

What does that suggest to you about the presentation/interpretation of data encoded with a topic map or not?

To me it says that beyond testing an interface for usability and meeting the needs of users, we need to start testing users’ understanding of the data presented by interfaces. Delivery of great information that leaves a user mis-informed (unless that is intentional) doesn’t seem all that helpful.

I am looking forward to reading Risk savvy : how to make good decisions. I don’t know that I will make “better” decisions but I will know when I am ignoring the facts. 😉

I first saw this in a tweet by Alastair Kerr.

July 3, 2014

statsTeachR

Filed under: R,Statistics — Patrick Durusau @ 2:35 pm

statsTeachR

From the webpage:

statsTeachR is an open-access, online repository of modular lesson plans, a.k.a. “modules”, for teaching statistics using R at the undergraduate and graduate level. Each module focuses on teaching a specific statistical concept. The modules range from introductory lessons in statistics and statistical computing to more advanced topics in statistics and biostatistics. We are developing plans to create a peer-review process for some of the modules submitted to statsTeachR.

There are twenty-five (25) modules now and I suspect they would welcome you help in contributing more.

The path to a more numerically and specifically statistically savvy public is to teach people to use statistics. So when numbers “don’t sound right,” they will have the confident to speak up.

Enjoy!

I first saw this in a tweet by Karthik Ram.

July 1, 2014

Introduction to Python for Econometrics, Statistics and Data Analysis

Filed under: Data Analysis,Python,Statistics — Patrick Durusau @ 7:04 pm

Introduction to Python for Econometrics, Statistics and Data Analysis by Kevin Sheppard.

From the introduction:

These notes are designed for someone new to statistical computing wishing to develop a set of skills necessary to perform original research using Python. They should also be useful for students, researchers or practitioners who require a versatile platform for econometrics, statistics or general numerical analysis (e.g. numeric solutions to economic models or model simulation).

Python is a popular general purpose programming language which is well suited to a wide range of problems. 1 Recent developments have extended Python’s range of applicability to econometrics, statistics and general numerical analysis. Python – with the right set of add-ons – is comparable to domain-specific languages such as MATLAB and R. If you are wondering whether you should bother with Python (or another language), a very incomplete list of considerations includes:

One of the more even-handed introductions I have read in a long time.

Enough examples and exercises to build some keyboard memory into your fingers! 😉

Bookmark this text so you can forward the link to others.

I first saw this in a tweet by yhat.

June 18, 2014

Topics and xkcd Comics

Filed under: Latent Dirichlet Allocation (LDA),Statistics,Topic Models (LDA) — Patrick Durusau @ 9:01 am

Finding structure in xkcd comics with Latent Dirichlet Allocation by Carson Sievert.

From the post:

xkcd is self-proclaimed as “a webcomic of romance, sarcasm, math, and language”. There was a recent effort to quantify whether or not these “topics” agree with topics derived from the xkcd text corpus using Latent Dirichlet Allocation (LDA). That analysis makes the all too common folly of choosing an arbitrary number of topics. Maybe xkcd’s tagline does provide a strong prior belief of a small number of topics, but here we take a more objective approach and let the data choose the number of topics. An “optimal” number of topics is found using the Bayesian model selection approach (with uniform prior belief on the number of topics) suggested by Griffiths and Steyvers (2004). After an optimal number is decided, topic interpretations and trends over time are explored.

Great interactive visualization, code for extracting data for xkcd comics, exploring “keywords that are most ‘relevant’ or ‘informative’ to a given topic’s meaning.”

Easy to see this post forming the basis for several sessions on LDA, starting with extracting the data, exploring the choices that influence the results and then visualizing the results of analysis.

Enjoy!

I first saw this in a tweet by Zoltan Varju.

June 15, 2014

Frequentism and Bayesianism: A Practical Introduction

Filed under: Bayesian Data Analysis,Statistics — Patrick Durusau @ 7:14 pm

Frequentism and Bayesianism: A Practical Introduction by Jake Vanderplas.

From the post:

One of the first things a scientist hears about statistics is that there is are two different approaches: frequentism and Bayesianism. Despite their importance, many scientific researchers never have opportunity to learn the distinctions between them and the different practical approaches that result. The purpose of this post is to synthesize the philosophical and pragmatic aspects of the frequentist and Bayesian approaches, so that scientists like myself might be better prepared to understand the types of data analysis people do.

I’ll start by addressing the philosophical distinctions between the views, and from there move to discussion of how these ideas are applied in practice, with some Python code snippets demonstrating the difference between the approaches.

This is the first of four posts that include Python code to demonstrate the impact of your starting position.

The other posts are:

Very well written and highly entertaining!

Jake leaves out another approach to statistics: Lying.

Lying avoids the need for a philosophical position or to have data for processing with Python or any other programming language. Even calculations can be lied about.

Most commonly found political campaigns, legislative hearings and the like. How you would characterize any particular political lie is left as an exercise for the reader. 😉

June 11, 2014

Exploring FBI Crime Statistics…

Filed under: Data Mining,FBI,Python,Statistics — Patrick Durusau @ 2:30 pm

Exploring FBI Crime Statistics with Glue and plotly by Chris Beaumont.

From the post:

Glue is a project I’ve been working on to interactively visualize multidimensional datasets in Python. The goal of Glue is to make trivially easy to identify features and trends in data, to inform followup analysis.

This notebook shows an example of using Glue to explore crime statistics collected by the FBI (see this notebook for the scraping code). Because Glue is an interactive tool, I’ve included a screencast showing the analysis in action. All of the plots in this notebook were made with Glue, and then exported to plotly (see the bottom of this page for details).
….

FBI crime statistics are used for demonstration purposes but Glue should be generally useful for exploring multidimensional datasets.

It isn’t possible to tell how “clean” or “consistent” the FBI reported crime data may or may not be. And as the FBI itself points out, comparison between locales is fraught with peril.

May 29, 2014

100+ Interesting Data Sets for Statistics

Filed under: Data,Statistics — Patrick Durusau @ 6:28 pm

100+ Interesting Data Sets for Statistics by Robert Seaton.

Summary:

Summary: Looking for interesting data sets? Here’s a list of more than 100 of the best stuff, from dolphin relationships to political campaign donations to death row prisoners.

If we have data, let’s look at data. If all we have are opinions, let’s go with mine.

—Jim Barksdale

Compiled using Robert’s definition of “interesting” but I will be surprised if you don’t agree in most cases.

Curated collections of pointers to data sets come to mind as a possible information product.

Enjoy!

I first saw this in a tweet by Aatish Bhatia.

May 21, 2014

OpenIntro Statistics

Filed under: Mathematics,Statistics — Patrick Durusau @ 6:44 pm

OpenIntro Statistics

From the about page:

The mission of OpenIntro is to make educational products that are free, transparent, and lower barriers to education.

The site includes a textbook, labs (R), videos, teachers resources, forums and extras, including data.

A good template for courses in other technical areas.

I first saw this in Chris Blattman’s Links I liked

Online Statistics Education:…

Filed under: Mathematics,Statistics — Patrick Durusau @ 4:58 pm

Online Statistics Education: An Interactive Multimedia Course of Study. Project Leader: David M. Lane, Rice University.

From the project homepage:

Online Statistics: An Interactive Multimedia Course of Study is a resource for learning and teaching introductory statistics. It contains material presented in textbook format and as video presentations. This resource features interactive demonstrations and simulations, case studies, and an analysis lab.

A far cry from introductory statistics pre-Internet. Definitely a resource to recommend to others.

I first saw this in Chris Blattman’s Links I liked

May 16, 2014

spurious correlations

Filed under: Humor,Statistics — Patrick Durusau @ 7:44 pm

spurious correlations

You need to put this site on your browser toolbar for meeting where “correlations” are likely to be discussed.

May save a lot of explaining and hand waving on your part about the nature of correlations and causation.

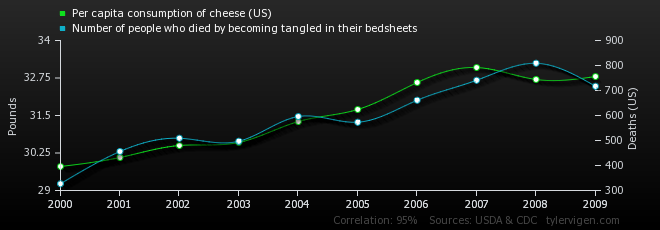
My favorite so far is:

Per capita consumption of cheese (US)

correlates with

Number of people who died by becoming entangled in their bed sheets

cheese and bedsheets

Notice the number of people who died entangled in their bedsheets is 150X the number of Americans who died in domestic terror attacks in 2013. (Death rates from terrorism)

Makes you wonder how much money we are spending to make bedsheets safer for U.S. citizens only.

I first saw this in a tweet by Steven Strogatz.

April 27, 2014

The Deadly Data Science Sin of Confirmation Bias

Filed under: Confidence Bias,Data Science,Statistics — Patrick Durusau @ 4:06 pm

The Deadly Data Science Sin of Confirmation Bias by Michael Walker.

From the post:

confirmation

Confirmation bias occurs when people actively search for and favor information or evidence that confirms their preconceptions or hypotheses while ignoring or slighting adverse or mitigating evidence. It is a type of cognitive bias (pattern of deviation in judgment that occurs in particular situations – leading to perceptual distortion, inaccurate judgment, or illogical interpretation) and represents an error of inductive inference toward confirmation of the hypothesis under study.

Data scientists exhibit confirmation bias when they actively seek out and assign more weight to evidence that confirms their hypothesis, and ignore or underweigh evidence that could disconfirm their hypothesis. This is a type of selection bias in collecting evidence.

Note that confirmation biases are not limited to the collection of evidence: even if two (2) data scientists have the same evidence, their respective interpretations may be biased. In my experience, many data scientists exhibit a hidden yet deadly form of confirmation bias when they interpret ambiguous evidence as supporting their existing position. This is difficult and sometimes impossible to detect yet occurs frequently.

Isn’t that a great graphic? Michael goes on to list several resources that will help in spotting confirmation bias, yours and that of others. Not 1005 but you will do better heeding his advice.

Be aware that the confirmation bias isn’t confined to statistical and/or data science methods. Decision makers, topic map authors, fact gatherers, etc. are all subject to confirmation bias.

Michael sees confirmation bias as dangerous to the credibility of data science, writing:

The evidence suggests confirmation bias is rampant and out of control in both the hard and soft sciences. Many academic or research scientists run thousands of computer simulations where all fail to confirm or verify the hypothesis. Then they tweak the data, assumptions or models until confirmatory evidence appears to confirm the hypothesis. They proceed to publish the one successful result without mentioning the failures! This is unethical, may be fraudulent and certainly produces flawed science where a significant majority of results can not be replicated. This has created a loss or confidence and credibility for science by the public and policy makers that has serious consequences for our future.
.
The danger for professional data science practitioners is providing clients and employers with flawed data science results leading to bad business and policy decisions. We must learn from the academic and research scientists and proactively avoid confirmation bias or data science risks loss of credibility.

I don’t think bad business and policy decisions need any help from “flawed data science.” You may recall that “policy makers” not all that many years ago dismissed a failure to find weapons of mass destruction, a key motivation for war, as irrelevant in hindsight.

My suggestion would be to make your data analysis as complete and accurate as possible and always keep digitally signed and encrypted copies of data and communications with your clients.

March 14, 2014

An R “meta” book

Filed under: Probability,R,Statistics — Patrick Durusau @ 7:13 pm

An R “meta” book by Joseph Rickert.

From the post:

Recently, however, while crawling around CRAN, it occurred to me that there is a tremendous amount of high quality material on a wide range of topics in the Contributed Documentation page that would make a perfect introduction to all sorts of people coming to R. Maybe, all it needs is a little marketing and reorganization. So, from among this treasure cache (and a few other online sources), I have assembled an R “meta” book in the following table that might be called: An R Based Introduction to Probability and Statistics with Applications.

What a very clever idea! There is lots of documentation already written and organizing it is simpler than re-doing it all from scratch. Not to mention less time consuming.

Take a close look at Joseph’s “meta” book and see what you think.

Perhaps there are other “meta” books hiding in the Contributed Documentation.

I first saw this in a tweet by David Smith.

February 22, 2014

MathDL Mathematical Communication

Filed under: Communication,Mathematics,Statistics — Patrick Durusau @ 3:53 pm

MathDL Mathematical Communication

From the post:

MathDL Mathematical Communication is a developing collection of resources for engaging students in writing and speaking about mathematics, whether for the purpose of learning mathematics or of learning to communicate as mathematicians.

This site addresses diverse aspects of mathematical communication, including

Here is a brief summary of suggestions to consider as you design a mathematics class that includes communication.

This site originated at M.I.T. so most of the current content is for teaching upper-level undergraduates to communicate as mathematicians.

The site is now yours. Contribute materials! Suggest improvements!

I discovered this site from a reference at Project Laboratory in Mathematics.

As the complexity of data and data analysis increases, so is you need to communicate mathematics and mathematics-based concepts to lay persons. There is much here that may assist in that task.

With enough experience: The wise you can persuade and the lesser folks you can daunt. 😉

« Newer PostsOlder Posts »

Powered by WordPress