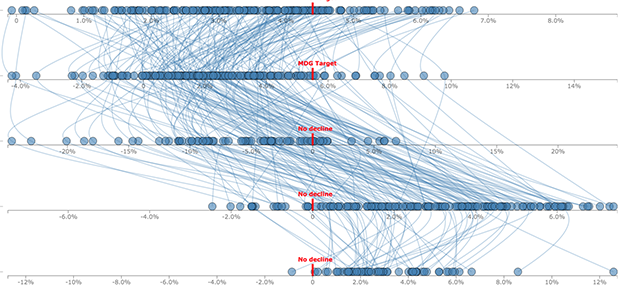
The 27 Worst Charts Of All Time by Walter Hickey.
Walter starts his post with:
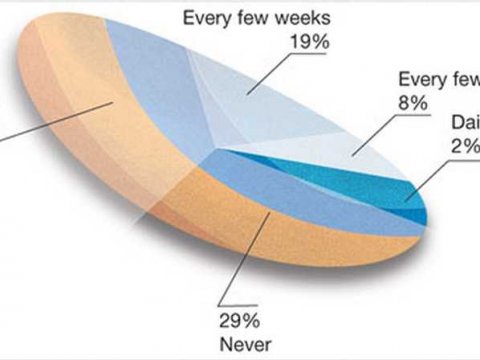
Impressively bad. Yes?
See Walter’s post for twenty-six (26) other examples of what not to do.
The 27 Worst Charts Of All Time by Walter Hickey.
Walter starts his post with:
Impressively bad. Yes?
See Walter’s post for twenty-six (26) other examples of what not to do.
23 Tools and Resources to Create Images for Social Media
From the post:
Through experimentation and iteration, we’ve found that including images when sharing to social media increases engagement across the board — more clicks, reshares, replies, and favorites.
Using images in social media posts is well worth trying with your profiles.
As a small business owner or a one-man marketing team, is this something you can pull off by yourself?
At Buffer, we create all the images for our blogposts and social media sharing without any outside design help. We rely on a handful of amazing tools and resources to get the job done, and I’ll be happy to share with you the ones we use and the extras that we’ve found helpful or interesting.
If you tend to scroll down numbered lists (like I do), you will be left thinking the creators of the post don’t know how to count:

because:

the end of the numbered list, isn’t 23.
If you look closely, there are several lists of unnumbered resources. So, you’re thinking that they do know how to count, but some of the items are unnumbered.
Should be, but it’s not. There are thirteen (13) unnumbered items, which added to fifteen (15), makes twenty-eight (28).
So, I suspect the title should read: 28 Tools and Resources to Create Images for Social Media.
In any event, its a fair collection of tools that with some effort on your part, can increase your social media presence.
Enjoy!
From the webpage:
These code examples accompany the O’Reilly video course “Intermediate d3.js: Charts, Layouts, and Maps”.
This video is preceded by the introductory video course “An Introduction to d3.js: From Scattered to Scatterplot”. I recommend watching and working through that course before attempting this one.
Some of these examples are adapted from the sample code files for Interactive Data Visualization for the Web (O’Reilly, March 2013).
If you have been looking to step up your d3 skills, here’s the opportunity to do so!
Enjoy!
LuxRender – Physically Based Renderer.
From the webpage:
LuxRender is a physically based and unbiased rendering engine. Based on state of the art algorithms, LuxRender simulates the flow of light according to physical equations, thus producing realistic images of photographic quality.
LuxRender is now a member project of the Software Freedom Conservancy which provides administrative and financial support to FOSS projects. This allows us to receive donations, which can be tax deductible in the US.
…
Physically based spectral rendering
LuxRender is built on physically based equations that model the transportation of light. This allows it to accurately capture a wide range of phenomena which most other rendering programs are simply unable to reproduce. This also means that it fully supports high-dynamic range (HDR) rendering.
Materials
LuxRender features a variety of material types. Apart from generic materials such as matte and glossy, physically accurate representations of metal, glass, and car paint are present. Complex properties such as absorption, dispersive refraction and thin film coating are available.
Fleximage (virtual film)
The virtual film allows you to pause and continue a rendering at any time. The current state of the rendering can even be written to a file, so that the computer (or even another computer) can continue rendering at a later moment.
Free for everyone
LuxRender is and will always be free software, both for private and commercial use. It is being developed by people with a passion for programming and for computer graphics who like sharing their work. We encourage you to download LuxRender and use it to express your artistic ideas. (learn more)
Too advanced for my graphic skills but I thought some of you might find this useful in populating your topic maps with high-end visualizations.
I first saw this in a tweet by David Bucciarelli that announced the LuxRender v1.5RC1 release.
Otherworldly CAD Software Hails From A Parallel Universe by Joshua Vasquez.
From the post:
The world of free 3D-modeling software tends to be grim when compared to the expensive professional packages. Furthermore, 3D CAD modeling software suggestions seem to throw an uproar when new users seek open-source or inexpensive alternatives. Taking a step apart from the rest, [Matt] has developed his own open-source CAD package with a spin that inverts the typical way we do CAD.
Antimony is a fresh perspective on 3D modeling. In contrast to Blender’s “free-form sculpting” and Solidworks’ sequential extrudes and cuts, Antimony invites you to break down your model into a network of both primitive geometry and operations that interact with that geometry.
Functionally, Antimony represents objects as a graphical collection of nodes that encode both primitives and operations. Want a cylinder? Start with a circle node and pipe it into an extrude node. Need to cut out some part geometry? Try defining it with one or more primitives, and then perform a boolean intersection operation. Users can even write their own nodes with custom scripts written in Python. Overall, Antimony boasts the power of parametric design similar to OpenSCAD while it also boosts readability with a graphical, rather than text-based, part description. Finally, because part geometry is essentially stored as a series of instructions, the process of modeling the part does not limit the resolution of the output .STL mesh. (Think: vector-based images, versus pixel-based images).
Current versions of the software are available for both Mac and Linux, and the entire project is open-source and available on the Githubs. (For the shrewd-eyed software developers, most of the project is written with Python that interacts with lower-level routines handled in C++ and exposed through Boost.Python.) Take a video tour of an Antimony workflow with [Matt] after the break. All-in-all, despite that the software is still in its alpha stages, it’s highly functional and (for the block-diagram fans) intuitive. We’re thrilled to put our programming hats on and try CAD from, as [Matt] coins it “a parallel universe.”
For all you graph lovers, parts are linked as a graph.
If you are looking for a project, try modeling historical clatrops. They remain as effective as they were in the time of Alexander the Great.
Vintage Infodesign [122] by Tiago Veloso.
From the post:
Published in October, 1940, the set of maps from Fortune magazine that open today’s Vintage Infodesign was part of a special about the industrial resources committed to the war effort by the United States. It used data compiled by the Bureau of the Census and Agricultural Commission, with the financial support by the Defense Commission. The maps within the four page report are signed by Philip Ragan Associates.
It’s just another great gem archived over at Fulltable, followed by the usual selection of ancient maps, graphics and charts from before 1960.
Hope you enjoy, and have a great week!
One original image (1940) and it modern counterpart to temp you into visiting this edition of Vintage Infodesign.
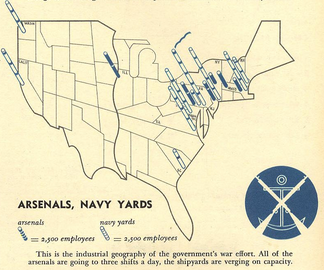
US shipyards and arsenals in 1940.
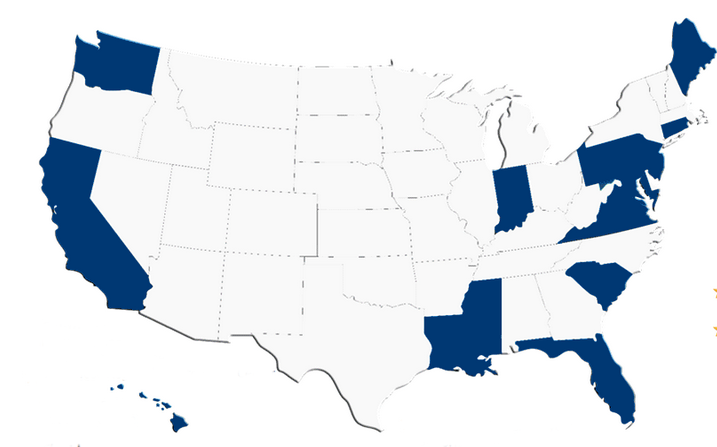
Modern map of shipyards. I couldn’t find an image quickly that had arsenals as well.
Notice the contrast in the amount of information given by the 1940 map versus that of the latest map from the Navy.
With the 1940 map, along with a state map I could get within walking distance of any of the arsenals or shipyards listed.
With the modern map, I know that shipyards need to be near water but it is only narrowed down to the coastline of any of the states with shipyards.
That may not seem like a major advantage, knowing the location of a shipyard from a map, but collating that information with a stream of other bits and pieces could be an advantage.
Such as watching wedding announcements near Navy yards for sailors getting married. Which means the happy couple will be on their honeymoon and any vehicle at their home with credentials to enter a Navy yard will be available. Of course, that information has to be co-located for the opportunity to present itself. For that I recommend topic maps.
htmlwidgets for Rich Data Visualization in R
From the webpage:
With the booming popularity of big data and data science, nice visualizations are getting a lot of attention. Sure, R and Python have built-in support for basic graphs and charts, but what if you want more. What if you want interaction so you can mouse-over or rotate a visualization. What if you want to explore more than a static image? Enter Rich Visualizations.
And, creating them is not as hard as you might think!
Four compelling examples of interactive graphics using htmlwidgets to bring interactivity to R code.
At first I thought this might be useful for an interactive map of cybersecurity incompetence inside the DC beltway but quickly realized that a map with only one uniform feature isn’t all that useful.
I am sure htmlwidgets will be useful for many other visualizations!
Enjoy!
Portfolio of the Week – Josemi Benítez by Tiago Veloso.
From the post:
It’s an indisputable fact that Spain has produced some of the most inspiring visual journalists of the last two decades, and we are quite happy to present you today the work of another one of those talented designers: Josemi Benítez, who has been responsible for the graphics section of the newspaper El Correo (Bilbao) for seven years.
Josemi began in the world of storytelling through images and texts working as a freelance artist for several advertising agencies, while getting degrees in Journalism and Advertising at the Universidad del País Vasco. In 1999 he began working as a Web designer in the Bilbao newspaper, helping to create elcorreo.com.
In 2002, Josemi returned to the paper version of the newspaper, coinciding with a key moment of the graphic evolution of the El Correo. Infographics gained space and a new style of graphics was buzzing. Since then, his work has been awarded a number of times by the Society for News Design and Malofiej News Design awards. In addition to his work at El Correo, he also taught infographic design at the University of Navarra and the Master in Multimedia El Correo-UPV / EHU.
Here are the works Josemi sent us:
…
I hesitate to call the examples infographics because they are more nearly works of communicative art. Select several for full size viewing and see if you agree.
Time spent with these images to incorporate these techniques in your own work would be time well spent.
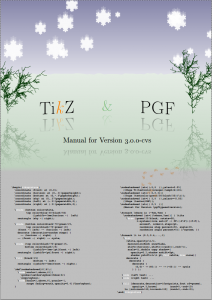
TIkZ & PGF by Till Tantau.
 ”
”
From the introduction:
Welcome to the documentation of
TikZand the underlyingpgfsystem. What began as a smallLaTEXstyle for creating the graphics in my (Till Tantau’s) PhD thesis directly withpdfLATEXhas now grown to become a full-flung graphics language with a manual of over a thousand pages. The wealth of options offered byTikZis often daunting to beginners; but fortunately this documentation comes with a number slowly-paced tutorials that will teach you almost all you should know aboutTikZwithout your having to read the rest….
The examples will make you want to install the package just to see if you can duplicate them. Some of the graphics I am unlikely to ever use. On the other hand, going over this manual in detail will enable you to recognize what is possible, graphically speaking.
This is truly going to be a lot of fun!
Enjoy!
Understanding Data Visualisations by Andy Kirk.
From the webpage:
Regular readers will be somewhat aware of my involvement in a research project called ‘Seeing Data’, a 15 month study funded by the UK Arts and Humanities Research Council and led by Professor Helen Kennedy from the University of Sheffield.
The aim of ‘Seeing Data’ was to further our understanding about how people make sense of data visualisations. Through learning about the ways in which people engage with data visualisations our aim was to provide some key resources for the general public, to help them develop the skills they need to interact with visualisations, and also for visualisation designers/producers, to help them understand what matters to the people who view and engage with their visualisations.
We are now concluding our findings and beginning our dissemination of a range of outputs to fulfil our aims.
This looks very promising! Each section leads to a fuller presentation with an opportunity to test yourself at the end of each section.
Will results on visualization in the UK will hold true for subjects in other locations? If there are differences, what are they and how are those variances understood?
Looking forward to more details on the project!
I first saw this in a tweet by Amanda Hobbs.
Telling your data’s story: How storytelling can enhance the effectiveness of your visualizations by Michael Freeman.
From the post:
Visualizing complex relationships in big data often requires involved graphical displays that can be intimidating to users. As the volume and complexity of data collection and storage scale exponentially, creating clear, communicative, and approachable visual representations of that data is an increasing challenge. As a data visualization specialist, I frightened one of my first sets of collaborators when I suggested using this display:
What I had failed to communicate was that we would use a story structure to introduce audiences to the complex layout (you can see how I did it here).
Michael tackles big data visualizations that are unclear, present too much information and too many variables.
Most of us can produce visualizations that frighten and confuse, but how many of us can construct visualizations that inform and persuade?
There isn’t a cookie cutter solution to the problem of effectively visualizing data but this post will gently move you in the direction of better visualizations.
Enjoy!
PS: Not that anyone has ever seen a topic map visualization that frightened rather than informed. 😉
Blog Radar at VisuaLoop.
You can run a search with your favorite search engine on “visualization blogs” + “data-visualization blogs” and get about 6,500 “hits,” including duplicates. This is the weed yourself option.
Or you can choose Blog Radar and have forty (40) blogs without duplicates with three (3) posts for each one. This is the pre-weeded option.
Whether you want to expand your blog reading or are looking for a good starting point for a crawler on visualization, you will be hard pressed to find a better resource.
Enjoy!
Teaching and Learning Data Visualization: Ideas and Assignments by Deborah Nolan, Jamis Perrett.
Abstract:
This article discusses how to make statistical graphics a more prominent element of the undergraduate statistics curricula. The focus is on several different types of assignments that exemplify how to incorporate graphics into a course in a pedagogically meaningful way. These assignments include having students deconstruct and reconstruct plots, copy masterful graphs, create one-minute visual revelations, convert tables into `pictures’, and develop interactive visualizations with, e.g., the virtual earth as a plotting canvas. In addition to describing the goals and details of each assignment, we also discuss the broader topic of graphics and key concepts that we think warrant inclusion in the statistics curricula. We advocate that more attention needs to be paid to this fundamental field of statistics at all levels, from introductory undergraduate through graduate level courses. With the rapid rise of tools to visualize data, e.g., Google trends, GapMinder, ManyEyes, and Tableau, and the increased use of graphics in the media, understanding the principles of good statistical graphics, and having the ability to create informative visualizations is an ever more important aspect of statistics education.
You will find a number of ideas in this paper to use in teaching and learning visualization.
I understand that visualizing a table can, with the proper techniques, display relationships that are otherwise difficult to notice.
On the other hand, due to our limited abilities to distinguish colors, graphs can conceal information that would otherwise be apparent from a table.
Not an objection to visualizing tables but a caution that details can get lost in visualization as well as being highlighted for the viewer.
NYC 311 with Turf by Morgan Herlocker.
From the post:
In this example, Turf is processing and visualizing the largest historical point dataset on Socrata and data.gov. The interface below visualizes every 311 call in NYC since 2010 from a dataset that weighs in at nearly 8 GB.
An excellent visualization from Mapbox to start a Friday morning!
The Turf homepage reports: “Advanced geospatial analysis for browsers and node.”
Wikipedia on 311 calls.
The animation is interactive and can lead to some interesting questions. For example, when I slow down the animation (icons on top), I can see a pattern that develops in Brooklyn with a large number of calls from November to January of each year (roughly and there are other patterns). Zooming in, I located one hot spot at the intersection of Woodruff Ave. and Ocean Ave.
The “hotspot” appears to be an artifact of summarizing the 311 data because the 311 records contain individual addresses for the majority of reports. I say “majority,” I didn’t download the data set to verify that statement, just scanned the first 6,000 or so records.
Deeper drilling into the data could narrow the 311 hotspots to block or smaller locations.
As you have come to expect, Mapbox has a tutorial on using Turf analysis.
If this hasn’t captured your interest yet, perhaps the keywords, composable, scale, scaling, will:
Unlike a traditional GIS database, Turf’s flexibility allows for composable algorithms that scale well past what fits into memory or even on a single machine.
Morgan discusses a similar project and the use of steamgraphs. Great way to start a Friday!
Tiago Veloso has posted hundreds of links to visualizations and resources that have never appeared on Data Viz News, with one post per day between March 2 – 7, 2015.
Which highlights a problem Tiago needs your assistance to solve. From the first post:
At long last, we return to our weekly round ups of the best links about data visualization. Well, it hasn’t been that long, but when you look at what has already taken place since our last post, well, it does seem like an eternity. So much has happened in the first two months of 2015!
This means, of course, that we have a lot of catching up to do! Yes, we could just bring you the most recent articles, interviews and resources. But we’ll try to mix in some of the amazing content already published during this past 60 days, so that we may continue to feature the very best content related to visualization, infographic design, visual journalism, cartography, and much more.
That said, we have been also thinking hardly about alternatives to these long, many times overwhelming, gigantic posts. When we created Data Viz News, we were sure that there was enough content to make an appealing, interesting weekly round up just with links about the fields closer to our interests. Now, almost two years later, the question is sort of if we have content for such a post… every day!
So, while today’s post – and the upcoming ones, all to be posted this week – are still in that very same format, we are intensively looking for alternatives, and your help would be very much appreciated: just let us know on Twitter (@visualoop) what you think would be the best way to deliver this much amount of articles. Looking forward for your ideas.
Our cup runs over with data visualization content.
Taking those six days as a data set, how would you organize the same material?
Data Visualization as a Communication Tool by Susan [Gardner] Archambault, Joanne Helouvry, Bonnie Strohl, and Ginger Williams.
Abstract:
This paper provides a framework for thinking about meaningful data visualization in ways that can be applied to routine statistics collected by libraries. An overview of common data display methods is provided, with an emphasis on tables, scatter plots, line charts, bar charts, histograms, pie charts, and infographics. Research on “best practices” in data visualization design is presented as well as a comparison of free online data visualization tools. Different data display methods are best suited for different quantitative relationships. There are rules to follow for optimal data visualization design. Ten free online data visualization tools are recommended by the authors.
Good review of basic visualization techniques with an emphasis on library data. You don’t have to be in Tufte‘s league in order to make effective data visualizations.
From the webpage:
DRAKON is a visual language for specifications from the Russian space program. DRAKON is used for capturing requirements and building software that controls spacecraft.
The rules of DRAKON are optimized to ensure easy understanding by human beings.
DRAKON is gaining popularity in other areas beyond software, such as medical textbooks. The purpose of DRAKON is to represent any knowledge that explains how to accomplish a goal.
DRAKON Editor is a free tool for authoring DRAKON flowcharts. It also supports sequence diagrams, entity-relationship and class diagrams.
With DRAKON Editor, you can quickly draw diagrams for:
- software requirements and specifications;
- documenting existing software systems;
- business processes;
- procedures and rules;
- any other information that tells “how to do something”.
DRAKON Editor runs on Windows, Mac and Linux.
The user interface of DRAKON Editor is extremely simple and straightforward.
Software developers can build real programs with DRAKON Editor. Source code can be generated in several programming languages, including Java, Processing.org, D, C#, C/C++ (with Qt support), Python, Tcl, Javascript, Lua, Erlang, AutoHotkey and Verilog
I note with amusement that the DRAKON editor has no “save” button. Rest easy! DRAKON saves all input automatically, removing the need for a “save” button. About time!
I am in the middle of an upgrade so look for sample images next week.
This is Visual Journalism [100] by Tiago Veloso.
From the post:
Edition number one hundred of our round up of infographics from the print industry, and the selection we pulled together today is a perfect celebration – after all, we have dozens of new works from newsrooms all over the world, making this one of the biggest selections published on Visualoop so far.
And in less than a month, we’ll be covering the 23rd edition of Malofiej Awards – the world’s main stage for journalistic infographics. We’ve actually begun our coverage, with two great posts: our friend Marco Vergotti, infographic editor of Época magazine, made this special infographic about last year’s Malofiej Awards; and this exclusive interview with the main responsible for the success of the event, the Spanish journalist Javier Errea. If you missed these posts, we definitively recommend you to read them.
I count fifty-four (54) stunning infographics from print publications.
Before you skip these as “just print infographics” remember that print infographics can’t rely on interaction with a user.
They either capture the attention of a reader or fail, usually miserably.
Which of these capture your attention? How would you duplicate that in a more forgiving digital environment?
PS: If you can’t capture and hold a user’s attention, the quality or capabilities of your software aren’t going to have an opportunity to shine.
100 pieces of flute music – A quantified self project where music and design come together by Erika von Kelsch.
From the post:
(image: The final infographic | Erika von Kelsch)
The premise of the project was to organize 100 pieces of data into a static print piece. At least 7 metadata categories were to be included within the infographic, as well as a minimum of 3 overall data rollups. I chose 100 pieces of flute music that I have played that have been in my performance repertoire. Music was a potential career path for me, and the people and experiences I had through music influence how I view and explore the world around me to this day. The way I approach design is also influenced by what I learned from studying music, including the technical aspects of both flute and theory, as well as the emotional facets of performance. I decided to use this project as a vehicle to document this experience.
Not only is this a great visualization but the documentation of the design process is very impressive!
Have you ever attempted to document your design process during a project? That is what actually happened as opposed to what “must have happended” in the design process?
Best of the Visualization Web… December 2014 by Andy Kirk.
From the post:
At the end of each month I pull together a collection of links to some of the most relevant, interesting or thought-provoking web content I’ve come across during the previous month. Here’s the latest collection from December 2014.
Andy lists:
Forty (40) links to visualizations.
Thirteen (13) links to articles.
Seven (7) links to learning and development.
Seven (7) links on visualization as a subject.
Six (6) sundry links that may be of interest.
Out of seventy-three (73) links, not one visual!
I rather like that because you can quickly scan Andy’s one line descriptions far faster than you could scroll through a sample from each site.
Worth bookmarking and returning to on a regular basis.
Cool Interactive experiments of 2014
From the post:
As we continue to look back at 2014, in search of the most interesting, coolest and useful pieces of content that came to our attention throughout the year, it’s only natural that we find projects that, despite being much less known and spoken of by the data visualization community than the ones of “The New York Times” or “The Washington Post”, have a certain “je ne sais quoi” to it, either it’s the project’s overall aesthetics, or the type of the data visualized.
Most of all, these projects show how wide the range of what visualization can be used for, outside the pressure of a client, a deadline or a predetermined tool to use. Self-promoting pieces, despite the low general value they might have, still play a determinant role in helping information designers test and expand their skills. Experimentation is at the core of this exciting time we are living in, so we gathered a couple of dozens of visual experiments that we had the opportunity to feature in our weekly “Interactive Inspiration” round ups, published every Friday.
Very impressive! I will just list the titles for you here:
If they have this sort of eye candy every Friday, mark me down as a regular visitor to VisualLoop.
BTW, I could have used XSLT to scrape the titles from the HTML but since there weren’t any odd line breaks, a regex in Emacs did the same thing with far fewer keystrokes.
I sometimes wonder if “interactive visualization” focuses too much on the visualization reacting to our input? After all, we are already interacting with visual stimuli in ways I haven’t seen duplicated on the image side. In that sense, reading books is an interactive experience, just on the user side.
Interactive Data Visualization for the Web by Scott Murray.
From the webpage:
This online version of Interactive Data Visualization for the Web includes 44 examples that will show you how to best represent your interactive data. For instance, you’ll learn how to create this simple force layout with 10 nodes and 12 edges. Click and drag the nodes below to see the diagram react.
When you follow the link to the O’Reilly site, just ignore the eBook pricing and go directly to “read online.”
Much crisper than the early version I mention at: Interactive Data Visualization for the Web [D3].
I first saw this in a tweet by Kirk Borne.
The ggplot2 book by Hadley Wickham
From the post:
Since ggplot2 is now stable, and the ggplot2 book is over five years old and rather out of date, I’m also happy to announce that I’m working on a second edition. I’ll be ably assisted in this endeavour by Carson Sievert, who’s so far done a great job of converting the source to Rmd and updating many of the examples to work with ggplot2 1.0.0. In the coming months we’ll be rewriting the data chapter to reflect modern best practices (e.g. tidyr and dplyr), and adding sections about new features.
We’d love your help! The source code for the book is available on github. If you’ve spotted any mistakes in the first edition that you’d like to correct, we’d really appreciate a pull request. If there’s a particular section of the book that you think needs an update (or is just plain missing), please let us know by filing an issue. Unfortunately we can’t turn the book into a free website because of my agreement with the publisher, but at least you can now get easily get to the source.
Great opportunity to show off your favorite feature of ggplot2. Might even make it into the next version of the text!
I first saw this in a tweet by Christophe Lalanne.
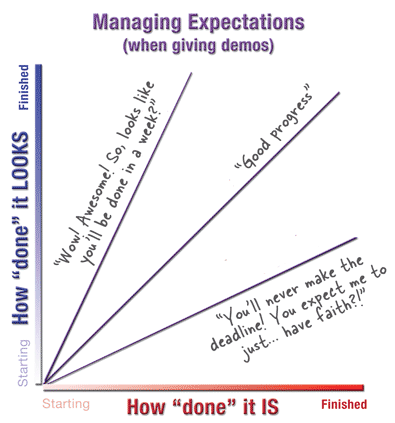
Don’t make the Demo look Done by Kathy Sierra.
From the post:
When we show a work-in-progress (like an alpha release) to the public, press, a client, or boss… we’re setting their expectations. And we can do it one of three ways: dazzle them with a polished mock-up, show them something that matches the reality of the project status, or stress them out by showing almost nothing and asking them to take it “on faith” that you’re on track.
The bottom line:
How ‘done’ something looks should match how ‘done’ something is.
Not recent but very sound advice!
The only thing I would add is: Don’t BS your testers about how the demo is going to improve before going live before the customer. Not going to happen.
From the webpage:
PhantomFlow
UI testing with decision trees. An experimental approach to UI testing, based on Decision Trees. A NodeJS wrapper for PhantomJS, CasperJS and PhantomCSS, PhantomFlow enables a fluent way of describing user flows in code whilst generating structured tree data for visualisation.
The above visualisation is a real-world example, showing the complexity of visual testing at Huddle.
Aims
- Enable a more expressive way of describing user interaction paths within tests
- Fluently communicate UI complexity to stakeholders and team members through generated visualisations
- Support TDD and BDD for web applications and responsive web sites
- Provide a fast feedback loop for UI testing
- Raise profile of visual regression testing
- Support misual regression workflows, quick inspection & rebasing via UI.
If you are planning on being more user focused (translation: successful in gaining users) this year, PhantomFlow may be the tool for you!
It strikes me as a tool that can present the workflow differently than you are accustomed to seeing it. I find that helpful because I will overlook potential difficulties because I already know how some function works.
The red button labeled STOP! may mean to a user that the application stops. Not that the decryption key on the hard drive is trashed to prevent decryption even if I give up the key under torture. That may not occur to them. If that happens on their hard drive, they may be rather miffed.
Developing a D3.js Edge by Chris Viau, Andrew Thornton, Ger Hobbelt, and Roland Dunn. (book)
From the description:
D3 is a powerful framework for producing interactive data visualizations. Many examples created in the real world with D3, however, can best be described as “spaghetti code.” So, if you are interested in using D3 in a reusable and modular way, which is of course in line with modern development practices, then this book is for you!
This book is aimed at intermediate developers, so to get the most from this book you need to know some JavaScript, and you should have experience creating graphics using D3. You will also want to have a good debugger handy (Chrome Developer panel or the Firefox/Firebug combo), to help you step through the many real world examples that you’ll find in this book. You should also be somewhat comfortable with any of these concepts:
…
If you read Kurt Cagle’s Ten Trends in Data Science 2015, you will recall him saying that 2014: “…demand for good data visualizers went from tepid to white hot” with the anticipation the same will be true for 2015.
Do note the qualifier “good.” That implies to me more than being able to use the stock charts and tools that you find in many low-end data tools.
Unlike the graphic capabilities of low-end data tools, D3 is limited more by your imagination than any practical limit to D3.
So, dust off your imagination and add D3 to your tool belt for data visualization.
PS: All the source code is here: https://github.com/backstopmedia/D3Edge
A remarkable collection of back issues of U&lc.
To best explain the almost twenty-seven year run of U&lc, I offer this editorial from volume 1, issue 1:
Why U&lc?
The world of graphic arts is alive today with new technological advances, so vast and difficult to comprehend, that they strain the imagination of even the most knowledgeable and creatively gifted among us. New materials, new tools, new ways to plan work are becoming mandatory for efficiency, quality, economy—presenting problems for all—printers, typesetters, artists, writers, advertisers, publishers—all the creative people who have anything to do with preparation of the visual word.
How to keep up? How to stay in touch with what is current? How to plan for tomorrow? To envision a future essential to decision making today?
Vital questions for the interested professional. Yet where can he find the most recent information on trends, styles, fashions? Where can he read about all and everything that is happening in the graphic arts and sciences?
To help make this broad body of knowledge and information available—and, hopefully, to provide some answers— International Typeface Corporation introduces this first issue of “U&/c,”the International Journal of Typo/Graphics, designed by Herb Lubalin and distributed worldwide.
“U&lc”will have broad general appeal, covering important graphic events and presenting original articles by world leaders in the typographic arts, as well as reprints of articles of importance that have appeared in other publications.
“U&/c”will feature outstanding examples of typographic design in all fields of visual communication, from the best-known creators to the undiscovered shops.
“U&lc” will offer in-depth analysis of the material presented and study the direction of current work and developments in typographic technology.
In brief, “U&k”will provide a panoramic window, a showcase for the world of graphic arts—a clearinghouse for the international exchange of ideas and information.
It is the intent of the editorial staff and the directors of ITC that “U&/c” will come to serve as the international journal for all who want to have their finger on “what is new’,’ “what is happening’: and “what to look for” in the world of typographics.
The Editors
Fonts, graphics, page layout as as important to communication as language, grammar, style, content, experience, context and a host of other known and unknown factors. Life may or may not be a miracle. But that communication happens at all, is certainly a miracle.
Fonts and graphic layout are two known factors that impact communication and you would do well to appreciate them, even as you seek the advice of experts for screen or print communication with users.
Enjoy!
PS: This remarkable collection is hosted at Fonts.com. A remarkable collection of information on typography in its own right.
19 Amazing Sites To Get Free Stock Photos (SideJobr)
From the post:
As you are building your website photography is always an integral part of web design. If you use google image search you will find crappy or low res images of staged people on the phone or shaking hands. These photos are not only going to cheapen your site but many cost money! Stop the insanity!
As a small business owner myself, having quality photos on my site is imperative to convey professionalism and get customers. Secretly, I am just a cheap person and hate to spend more money than is necessary and trust me, it is not necessary to spend money on quality stock photos.
In this post, we’ve created a list for you of awesome websites that have free stock photos.
This is not the end all – be all of sites and if you find others, please feel free to list them in the comment section.
Note: Most of these images fall under a creative commons license (just make sure you attribute properly) or are old enough that the photos have returned to the public domain. (This happens once the copyright on an image expires.)
Reading is a recent and acquired skill when compared to image recognition, which appears to be handled by hard-wired machinery in our brains. (obvious once pointed out) The upshot of that observation (which I read, did not independently discover) is that I have been trying to use more images/graphics in my posts. This post by SideJobr is a collection of some sources for free stock photos. May be useful for your presentations, website, blog posts.
If retitled: A Hadoop Tea Party, would this image be more memorable than the usual yellow elephant in a slide presentation?

From New Old Stock as: Elephant’s tea party, Robur Tea Room, 24 March 1939, by Sam Hood.
20 new data viz tools and resources of 2014
From the post:
We continue our special posts with the best data viz related content of the year, with a useful list of new tools and resources that were made available throughout 2014. A pretty straightforward compilation that was much harder to produce than initially expected, we must say, since the number of mentions to include was way beyond our initial (poorly made) estimates. So many new options out there!
So, we had a hard time gathering 20 of those new platforms, tools and resources – if you’re a frequent reader of our weekly Data Viz News posts, you’ll might recall several of the mentions in this list, -, and we deliberately left out the new releases, versions and updates of existing tools, such as CartoDB, Mapbox, Tableau, D3.js, RAW, Infogr.am and others.
Of course, there’s always Visualising Data’s list of 250+ tools and resources for a much broader view of what’s available out there.
For now, here are the new resources and tools that caught our attention in 2014:
…
Kudos to Visualizing Data for doing the heavy lifting on this one. A site I need to follow in the coming year.
Graph data from MySQL database in Python
From the webpage:
All Python code for this tutorial is available online in this IPython notebook.
Thinking of using Plotly at your company? See Plotly’s on-premise, Plotly Enterprise options.
Note on operating systems: While this tutorial can be followed by Windows or Mac users, it assumes a Ubuntu operating system (Ubuntu Desktop or Ubuntu Server). If you don’t have a Ubuntu server, its possible to set up a cloud one with Amazon Web Services (follow the first half of this tutorial). If you’re using a Mac, we recommend purchasing and downloading VMware Fusion, then installing Ubuntu Desktop through that. You can also purchase an inexpensive laptop or physical server from Zareason, with Ubuntu Desktop or Ubuntu Server preinstalled.
Reading data from a MySQL database and graphing it in Python is straightforward, and all the tools that you need are free and online. This post shows you how. If you have questions or get stuck, email feedback@plot.ly, write in the comments below, or tweet to @plotlygraphs.
Just in case you want to start on adding a job skill over the holidays!
Whenever I see “graph” used in this sense, I wish it were some appropriate form of “visualize.” Unfortunately, “graphing” of data stuck too long ago to expect anyone to change now. To be fair, it is marking nodes on an edge, except that we treat all the space on one side or the other of the edge as significant.
Perhaps someone has treated the “curve” of a graph as a hyperedge? Connecting multiple nodes? I don’t know. You?
Whether they have or haven’t, I will continue to think of this type of “graphing” as visualization. Very useful but not the same thing as graphs with nodes/edges, etc.
Powered by WordPress