Mara Averick, @dataandme, tweets:
All the @rstudio Cheatsheets have been B&W printer-friendlier-ized
It’s a small thing but appreciated when documentation is B&W friendly.
PS: The @rstudio cheatsheets are also good examples layout and clarity.
Mara Averick, @dataandme, tweets:
All the @rstudio Cheatsheets have been B&W printer-friendlier-ized
It’s a small thing but appreciated when documentation is B&W friendly.
PS: The @rstudio cheatsheets are also good examples layout and clarity.
.Rddj Hand-curated, high quality resources for doing data journalism with R by Timo Grossenbacher.
From the webpage:
The R Project is a great software environment for doing all sorts of data-driven journalism. It can be used for any of the stages of a typical data project: data collection, cleaning, analysis and even (interactive) visualization. And it’s all reproducible and transparent! Sure, it requires a fair amount of scripting, yet…
Do not fear! With this hand-curated (and opinionated) list of resources, you will be guided through the thick jungle of countless R packages, from learning the basics of R’s syntax, to scraping HTML tables, to a guide on how to make your work comprehensible and reproducible.
Now, enjoy your journey.
Some more efforts at persuasion: As I work in the media, I know how a lot of journalists are turned off by everything that doesn’t have a graphical interface with buttons to click on. However, you don’t need to spend days studying programming concepts in order to get started with R, as most operations can be carried out without applying scary things such as loops or conditionals – and, nowadays, high-level abstrations like
dplyrmake working with data a breeze. My advice if you’re new to data journalism or data processing in general: Better learn R than Excel, ’cause getting to know Excel (and the countless other tools that each do a single thing) doesn’t come for free, either.This list is (partially) inspired by R for Journalists by Ed Borasky, which is another great resource for getting to know R.
… (emphasis in original)
The topics are familiar:
…
RStudio Syntax and basic R programming Collecting Data (from the Web) Data cleaning and manipulation Text mining / natural language processing Exploratory data analysis and plotting Interactive data visualization Publication-quality graphics Reproducibility Examples of using R in (data) journalism …
What makes this list of resources different from search results?
Hand curation.
How much of a difference?
Compare the search results of “R” + any of these categories to the resources here.
Bookmark .Rddj for data journalism and R, then ping me with the hand curated list of resources you are creating.
Save yourself and the rest of us from search. Thanks!
Security: The Dangers Of Copying And Pasting R Code.
From the post:
Most of the time when we stumble across a code snippet online, we often blindly copy and paste it into the R console. I suspect almost everyone does this. After all, what’s the harm?
…
The post illustrates how innocent appearing R code can conceal unhappy surprises!
Concealment isn’t limited to R code.
Any CSS controlled display is capable of concealing code for you to copy-n-paste into a console, terminal window, script or program.
Endless possibilities for HTML pages/emails with code + a “little something extra.”
What are your copy-n-paste practices?
Network analysis of Game of Thrones family ties by Shirin Glander.
From the post:
In this post, I am exploring network analysis techniques in a family network of major characters from Game of Thrones.
Not surprisingly, we learn that House Stark (specifically Ned and Sansa) and House Lannister (especially Tyrion) are the most important family connections in Game of Thrones; they also connect many of the storylines and are central parts of the narrative.
…
The basis for this network is Kaggle’s Game of Throne dataset (character-deaths.csv). Because most family relationships were missing in that dataset, I added the missing information in part by hand (based on A Wiki of Ice and Fire) and by scraping information from the Game of Thrones wiki. You can find the full code for how I generated the network on my Github page.
…
Glander improves network data for the Game of Thrones and walks you through the use of R to analyze that network.
It’s useful work and will repay close study.
Network analysis can used with all social groups, activists, bankers, hackers, members of Congress (U.S.), terrorists, etc.
But just as Ned Stark has no relationship with dire wolves when the story begins, networks of social groups develop, change, evolve if you will, over time.
Moreover, events, interactions, involving one or more members of the network, occur in time sequence. A social network that fails to capture those events and their sequencing, from one or more points of view, is a highly constrained network.
A useful network as Glander demonstrates but one cannot answer simple questions about the order in which characters gained knowledge that a particular character hurled another character from a very high window.
If I were investigating say a leak of NSA cybertools, time sequencing like that would be one of my top priorities.
Thoughts?
A community based aggregation resource on R.
Seventy-two (72) links plus R project updates in R Weekly 2017 Issue 8.
Great way to stay up on R resources and get a sense for the R community.
Enjoy!
PS: The first post of R Weekly that I reviewed had 6 links. R Weekly [Another Word for It post]
Text Mining the Tidy Way by Julia Silge.
Thanks to Julia’s presentation I now know there is an R package with all of Jane Austen’s novels ready for text analysis.
OK, Austen may not be at the top of your reading list, but the Tidy techniques Julia demonstrates are applicable to a wide range of textual data.
Among those mentioned in the presentation, NASA datasets!
Julia, along with Dave Robinson, wrote: Text Mining with R: A Tidy Approach, available online now and later this year from O’Reilly.
Predicting And Mapping Arrest Types in San Francisco with LightGBM, R, ggplot2 by Max Woolf.
Max does a great job of using open source data SF OpenData to predict arrest types in San Francisco.
It takes only a small step to realize that Max is also predicting the locations of police officers and their cellphones.
Without police officers, you aren’t going to have many arrests. 😉
Anyone operating a cellphone surveillance device can use Max’s predictions to gather data from police cellphones and other electronic gear. For particular police officers, for particular types of arrests, or at particular times of day, etc.
From the post:
The new hotness in the world of data science is neural networks, which form the basis of deep learning. But while everyone is obsessing about neural networks and how deep learning is magic and can solve any problem if you just stack enough layers, there have been many recent developments in the relatively nonmagical world of machine learning with boring CPUs.
Years before neural networks were the Swiss army knife of data science, there were gradient-boosted machines/gradient-boosted trees. GBMs/GBTs are machine learning methods which are effective on many types of data, and do not require the traditional model assumptions of linear/logistic regression models. Wikipedia has a good article on the advantages of decision tree learning, and visual diagrams of the architecture:
GBMs, as implemented in the Python package scikit-learn, are extremely popular in Kaggle machine learning competitions. But scikit-learn is relatively old, and new technologies have emerged which implement GBMs/GBTs on large datasets with massive parallelization and and in-memory computation. A popular big data machine learning library, H2O, has a famous GBM implementation which, per benchmarks, is over 10x faster than scikit-learn and is optimized for datasets with millions of records. But even faster than H2O is xgboost, which can hit a 5x-10x speed-ups relative to H2O, depending on the dataset size.
Enter LightGBM, a new (October 2016) open-source machine learning framework by Microsoft which, per benchmarks on release, was up to 4x faster than xgboost! (xgboost very recently implemented a technique also used in LightGBM, which reduced the relative speedup to just ~2x). As a result, LightGBM allows for very efficient model building on large datasets without requiring cloud computing or nVidia CUDA GPUs.
A year ago, I wrote an analysis of the types of police arrests in San Francisco, using data from the SF OpenData initiative, with a followup article analyzing the locations of these arrests. Months later, the same source dataset was used for a Kaggle competition. Why not give the dataset another look and test LightGBM out?
…
Cellphone data gathered as a result of Max’s predictions can be tested against arrest and other police records to establish the presence and/or absence of particular police officers at a crime scene.
After a police office corroborates the presence of a gun in a suspect’s hand, cellphone evidence they were blocks away, in the presence of other police officers, could prove to be inconvenient.
A Data Driven Exploration of Kung Fu Films by Jim Vallandingham.
From the post:
Recently, I’ve been a bit caught up in old Kung Fu movies. Shorting any technical explorations, I have instead been diving head-first into any and all Netflix accessible martial arts masterpieces from the 70’s and 80’s.
While I’ve definitely been enjoying the films, I realized recently that I had little context for the movies I was watching. I wondered if some films, like our latest favorite, Executioners from Shaolin, could be enjoyed even more, with better understanding of the context in which these films exist in the Kung Fu universe.
So, I began a data driven quest for truth and understanding (or at least a semi-interesting dataset to explore) of all Shaw Brothers Kung Fu movies ever made!
…
If you’re not familiar with the genre, here is a three-minute final fight collage from YouTube:
When I saw the title, I was hopeful that Jim had captured the choreography of the movies for comparison.
No such luck! 😉
That would be an extremely difficult and labor intensive task.
Just in case you are curious, there is a Dance Notation Bureau with extensive resources should you decide to capture one or more Kung Fu films in notation.
Or try Notation Reloaded: eXtensible Dance Scripting Notation by Matthew Gough.
A search using “xml dance notation” produces a number of interesting resources.
Three reasons to learn R today by David Smith.
From the post:
If you're just getting started with data science, the Sharp Sight Labs blog argues that R is the best data science language to learn today.
The blog post gives several detailed reasons, but the main arguments are:
- R is an extremely popular (arguably the most popular) data progamming language, and ranks highly in several popularity surveys.
- Learning R is a great way of learning data science, with many R-based books and resources for probability, frequentist and Bayesian statistics, data visualization, machine learning and more.
- Python is another excellent language for data science, but with R it's easier to learn the foundations.
Once you've learned the basics, Sharp Sight also argues that R is also a great data science to master, even though it's an old langauge compared to some of the newer alternatives. Every tool has a shelf life, but R isn't going anywhere and learning R gives you a foundation beyond the language itself.
If you want to get started with R, Sharp Sight labs offers a data science crash course. You might also want to check out the Introduction to R for Data Science course on EdX.
Sharp Sight Labs: Why R is the best data science language to learn today, and Why you should master R (even if it might eventually become obsolete)
If you need more reasons to learn R:
Glad to hear you are learning R!
How to weigh a dog with a ruler? (looking for translators)
From the post:
We are working on a series of comic books that introduce statistical thinking and could be used as activity booklets in primary schools. Stories are built around adventures of siblings: Beta (skilled mathematician) and Bit (data hacker).
What is the connection between these comic books and R? All plots are created with
ggplot2.The first story (How to weigh a dog with a ruler?) is translated to English, Polish and Czech. If you would like to help us to translate this story to your native language, just write to me (przemyslaw.biecek at gmail) or create an issue on GitHub. It’s just 8 pages long, translations are available on Creative Commons BY-ND licence.
…
The key is to chart animals by their height as against their weight.
Pricing US Representatives is likely to follow a similar relationship where their priced goes up by years of service in Congress.
I haven’t run the data but such a chart would keep “people” (includes corporations in the US) from paying too much or offering too little. To the embarrassment of all concerned.
David Smith’s post: Stylometry: Identifying authors of texts using R details the use of R to distinguish tweets by president-elect Donald Trump from his campaign staff. (Hmmm, sharing a Twitter account password, there’s bad security for you.)
The same techniques may distinguish texts delivered “live” versus those “inserted” into Congressional Record.
What other texts are ripe for distinguishing authors?
From the post:
Few people expect politicians to write every word they utter themselves; reliance on speechwriters and spokepersons is a long-established political practice. Still, it's interesting to know which statements are truly the politician's own words, and which are driven primarily by advisors or influencers.
Recently, David Robinson established a way of figuring out which tweets from Donald Trump's Twitter account came from him personally, as opposed to from campaign staff, whcih he verified by comparing the sentiment of tweets from Android vs iPhone devices. Now, Ali Arsalan Kazmi has used stylometric analysis to investigate the provenance of speeches by the Prime Minister of Pakistan.
…
A small amount of transparency can go a long way.
Email archives anyone?
No, not a post about R versus Python but about R and Tolstoy‘s War and Peace.
Using R to Gain Insights into the Emotional Journeys in War and Peace by Wee Hyong Tok.
From the post:
How do you read a novel in record time, and gain insights into the emotional journey of main characters, as they go through various trials and tribulations, as an exciting story unfolds from chapter to chapter?
I remembered my experiences when I start reading a novel, and I get intrigued by the story, and simply cannot wait to get to the last chapter. I also recall many conversations with friends on some of the interesting novels that I have read awhile back, and somehow have only vague recollection of what happened in a specific chapter. In this post, I’ll work through how we can use R to analyze the English translation of War and Peace.
War and Peace is a novel by Leo Tolstoy, and captures the salient points about Russian history from the period 1805 to 1812. The novel consists of the stories of five families, and captures the trials and tribulations of various characters (e.g. Natasha and Andre). The novel consists of about 1400 pages, and is one of the longest novels that have been written.
We hypothesize that if we can build a dashboard (shown below), this will allow us to gain insights into the emotional journey undertaken by the characters in War and Peace.
…
Impressive work, even though I would not use it as a short-cut to “read a novel in record time.”
Rather I take this as an alternative way of reading War and Peace, one that can capture insights a casual reader may miss.
Moreover, the techniques demonstrated here could be used with other works of literature, or even non-fictional works.
Imagine conducting this analysis over the reportedly more than 7,000 page full CIA Torture Report, for example.
A heatmap does not connect any dots, but points a user towards places where interesting dots may be found.
Certainly a tool for exploring large releases/leaks of text data.
Enjoy!
PS: Large, tiresome, obscure-on-purpose, government reports to practice on with this method?
Learning R programming by reading books: A book list by Liang-Cheng Zhang.
From the post:
Despite R’s popularity, it is still very daunting to learn R as R has no click-and-point feature like SPSS and learning R usually takes lots of time. No worries! As self-R learner like us, we constantly receive the requests about how to learn R. Besides hiring someone to teach you or paying tuition fees for online courses, our suggestion is that you can also pick up some books that fit your current R programming level. Therefore, in this post, we would like to share some good books that teach you how to learn programming in R based on three levels: elementary, intermediate, and advanced levels. Each level focuses on one task so you will know whether these books fit your needs. While the following books do not necessarily focus on the task we define, you should focus the task when you reading these books so you are not lost in contexts.
…
Books and reading form the core of my most basic prejudice: Literacy is the doorway to unlimited universes.
A prejudice so strong that I have to work hard at realizing non-literates live in and sense worlds not open to literates. Not less complex, not poorer, just different.
But book lists in particular appeal to that prejudice and since my blog is read by literates, I’m indulging that prejudice now.
I do have a title to add to the list: Practical Data Science with R by Nina Zumel and John Mount.
Judging from the other titles listed, Practical Data Science with R falls in the intermediate range. Should not be your first R book but certainly high on the list for your second R book.
Avoid the rush! Start working on your Amazon wish list today! 😉
How to get started with Data Science using R by Karthik Bharadwaj.
From the post:
R being the lingua franca of data science and is one of the popular language choices to learn data science. Once the choice is made, often beginners find themselves lost in finding out the learning path and end up with a signboard as below.
In this blog post I would like to lay out a clear structural approach to learning R for data science. This will help you to quickly get started in your data science journey with R.
…
You won’t find anything you don’t already know but this is a great short post to pass onto others.
Point out R skills will help them expose and/or conceal government corruption.
The new Tesseract package: High Quality OCR in R by Jeroen Ooms.
From the post:
Optical character recognition (OCR) is the process of extracting written or typed text from images such as photos and scanned documents into machine-encoded text. The new rOpenSci package tesseract brings one of the best open-source OCR engines to R. This enables researchers or journalists, for example, to search and analyze vast numbers of documents that are only available in printed form.
People looking to extract text and metadata from pdf files in R should try our pdftools package.
…
Reading too quickly at first I thought I had missed a new version of Tesseract (tesseract-ocr Github), an OCR program that I use on a semi-regular basis.
Reading a little slower, ;-), I discovered Ooms is describing a new package for R, which uses Tesseract for OCR.
This is great news but be aware that Tesseract (whether called by an R package or standalone) can generate a large amount of output in a fairly short period of time.
One of the stumbling blocks of OCR is the labor intensive process of cleaning up the inevitable mistakes.
Depending on how critical accuracy is for searching, for example, you may choose to verify and clean only quotes for use in other publications.
Best to make those decisions up front and not be faced with a mountain of output that isn’t useful unless and until it has been corrected.
The 5 most downloaded R packages
From the post:
Curious which R packages your colleagues and the rest of the R community are using? Thanks to Rdocumentation.org you can now see for yourself! Rdocumentation.org aggregates R documentation and download information from popular repositories like CRAN, BioConductor and GitHub. In this post, we’ll take a look at the top 5 R packages with the most direct downloads!
…
Sorry! No spoiler!
Do check out:
Rdocumentation.org aggregates help documentation for R packages from CRAN, BioConductor, and GitHub – the three most common sources of current R documentation. RDocumentation.org goes beyond simply aggregating this information, however, by bringing all of this documentation to your fingertips via the RDocumentaion package. The RDocumentation package overwrites the basic help functions from the utils package and gives you access to RDocumentation.org from the comfort of your RStudio IDE. Look up the newest and most popular R packages, search through documentation and post community examples.
As they say:
Create an RDocumentation account today!
I’m always sympathetic to documentation but more so today because I have wasted hours over the past two or three days on issues that could have been trivially documented.
I will be posting “corrected” documentation later this week.
PS: If you have or suspect you have poorly written documentation, I have some time available for paid improvement of the same.
How the Ghana Floods animation was created by David Quartey.
From the post:
Ghana has always been getting flooded, but it seems that only floods in Accra are getting attention. I wrote about it here, and the key visualization was an animated map showing the floods in Ghana, and built in R. In this post, I document how I did it, hopefully you can do one also!
…
David’s focus is on Ghana but the same techniques work for data of greater local interest.
I saw a tweet that the ggplot2 cheatsheet has been updated.
Here’s a list of all the cheatsheets available at RStudio:
Contributed Cheatsheets
I have deliberately omitted links as when cheat sheets are updated, the links will break and/or you will get outdated information.
Use and reference the RStudio Cheat Sheets page.
Enjoy!
An introduction to data cleaning with R by Edwin de Jonge and Mark van der Loo.
Summary:
Data cleaning, or data preparation is an essential part of statistical analysis. In fact, in practice it is often more time-consuming than the statistical analysis itself. These lecture notes describe a range of techniques, implemented in the R statistical environment, that allow the reader to build data cleaning scripts for data suffering from a wide range of errors and inconsistencies, in textual format. These notes cover technical as well as subject-matter related aspects of data cleaning. Technical aspects include data reading, type conversion and string matching and manipulation. Subject-matter related aspects include topics like data checking, error localization and an introduction to imputation methods in R. References to relevant literature and R packages are provided throughout.
These lecture notes are based on a tutorial given by the authors at the useR!2013 conference in Albacete, Spain.
Pure gold!
Plus this tip (among others):
Tip. To become an R master, you must practice every day.
The more data you clean, the better you will become!
Enjoy!
ggplot2 2.2.0 coming soon! by Hadley Wickham.
From the post:
I’m planning to release ggplot2 2.2.0 in early November. In preparation, I’d like to announce that a release candidate is now available: version 2.1.0.9001. Please try it out, and file an issue on GitHub if you discover any problems. I hope we can find and fix any major issues before the official release.
Install the pre-release version with:
# install.packages("devtools")
devtools::install_github("hadley/ggplot2")
If you discover a major bug that breaks your plots, please file a minimal reprex, and then roll back to the released version with:
install.packages("ggplot2")ggplot2 2.2.0 will be a relatively major release including:
- Subtitles and captions.
- A large rewrite of the facetting system.
- Improved theme options.
- Better stacking
- Numerous bug fixes and minor improvements.
The majority of this work was carried out by Thomas Pederson, who I was lucky to have as my “ggplot2 intern” this summer. Make sure to check out other visualisation packages: ggraph, ggforce, and tweenr.
…
Just in case you are casual about time, tomorrow is October 1st. Which on most calendars means that “early November” isn’t far off.
Here’s an easy opportunity to test ggplot2.2.2.0 and related visualization packages. Before the official release.
Enjoy!
The Simpsons by the Data by Todd Schneider.
From the post:
The Simpsons needs no introduction. At 27 seasons and counting, it’s the longest-running scripted series in the history of American primetime television.
The show’s longevity, and the fact that it’s animated, provides a vast and relatively unchanging universe of characters to study. It’s easier for an animated show to scale to hundreds of recurring characters; without live-action actors to grow old or move on to other projects, the denizens of Springfield remain mostly unchanged from year to year.
As a fan of the show, I present a few short analyses about Springfield, from the show’s dialogue to its TV ratings. All code used for this post is available on GitHub.
…
Alert! You must run Flash in order to access Simpsons World, the source of Todd’s data.
Advice: Treat Flash as malware and run in a VM.
Todd covers the number of words spoken per character, gender imbalance, focus on characters, viewership, and episode summaries (tf-idf).
Other analysis awaits your imagination and interest.
BTW, if you want comedy data a bit closer to the edge, try Text Mining South Park by Kaylin Walker. Kaylin uses R for her analysis as well.
Other TV programs with R-powered analysis?
A new weekly publication of R resources that began on 21 May 2016 with Issue 0.
Mostly titles of post and news articles, which is useful, but not as useful as short summaries, including the author’s name.
Presidential Election Predictions 2016 (an ASA competition) by Jo Hardin.
From the post:
In this election year, the American Statistical Association (ASA) has put together a competition for students to predict the exact percentages for the winner of the 2016 presidential election. They are offering cash prizes for the entry that gets closest to the national vote percentage and that best predicts the winners for each state and the District of Columbia. For more details see:
http://thisisstatistics.org/electionprediction2016/
To get you started, I’ve written an analysis of data scraped from fivethirtyeight.com. The analysis uses weighted means and a formula for the standard error (SE) of a weighted mean. For your analysis, you might consider a similar analysis on the state data (what assumptions would you make for a new weight function?). Or you might try some kind of model – either a generalized linear model or a Bayesian analysis with an informed prior. The world is your oyster!
…
Interesting contest but it is limited to high school and college students. Separate prizes, one for high school and one for college, $200.00 each. Oh, plus ASA memberships and a 2016 Election Prediction t-shirt.
For adults in the audience, strike up a prediction pool by state and/or for the nation.
The R Documentation Task Force: The Next Generation R Documentation System by Joseph Rickert and Hadley Wickham.
From the post:
Andrew Redd received $10,000 to lead a new ISC working group, The R Documentation Task Force, which has a mission to design and build the next generation R documentation system. The task force will identify issues with documentation that currently exist, abstract the current Rd system into an R compatible structure, and extend this structure to include new considerations that were not concerns when the Rd system was first implemented. The goal of the project is to create a system that allows for documentation to exist as objects that can be manipulated inside R. This will make the process of creating R documentation much more flexible enabling new capabilities such as porting documentation from other languages or creating inline comments. The new capabilities will add rigor to the documentation process and enable the the system to operate more efficiently than any current methods allow. For more detail have a look at the R Documentation Task Force proposal (Full Text).
The task force team hopes to complete the new documentation system in time for the International R Users Conference, UseR! 2017, which begins July 4th 2017. If you are interested in participating in this task force, please contact Andrew Redd directly via email (andrew.redd@hsc.utah.edu). Outline your interest in the project, you experience with documentation any special skills you may have. The task force team is particularly interested in experience with documentation systems for languages other than R and C/C++.
OK, I have a weakness for documentation projects!
See the full proposal for all the details but:
…
There are two aspects of R documentation I intend to address which will make R an exemplary system for documentation.The first aspect is storage. The mechanism of storing documentation in separate Rd files hinders the development process and ties documentation to the packaging system, and this need not be so. Life does not always follow the ideal; code and data are not always distributed via nice packages. Decoupling the documentation from the packaging system will allow for more dynamic and flexible documentation strategies, while also simplifying the process of transitioning to packages distributed through CRAN or other outlets.
The second aspect is flexibility of defining documentation. R is a language of flexibility and preference. There are many paths to the same outcome in R. While this has often been a source of confusion to new users of R, however it is also one of R’s greatest strengths. With packages flexibility has allowed for many contributions, some have fallen in favor while others have proven superior. Adding flexibility in documentation methods will allow for newer, and ideally improved, methods to be developed.
…
Have you seen the timeline?
- Mid-August 2016 notification of approval.
- September 1, 2016 Kickoff for the R Documentation Task Force with final members.
- September 16, 2016 Deadline for submitting posts to the R-consortium blog, the R-announce, Rpackage-devel, and R-devel mailing lists, announcing the project.
- September 1 through November 27th 2016 The task force conducts bi-weekly meetings via Lync to address issues in documentation.
- November 27th, 2016 Deadline for preliminary recommendations of documentation extensions. Recommendations and conflicts written up and submitted to the R journal to be published in the December 2016 issue.
- December 2016 Posts made to the R Consortium blog, and R mailing lists to coincide with the R Journal article to call for public participation.
- January 27, 2017 Deadline for general comments on recommendations. Work begins to finalize new documentation system.
- February 2017 Task force meets to finalize decisions after public input.
- February-May 2017 Task force meets monthly as necessary to monitor progress on code development.
- May 2017 Article is submitted outlining final recommendations and the subsequent tools developed to the R Journal for review targeting the June 2017 issue.
- July 4-7, 2017 Developments will be presented at the International R users conference in Brussels, Belgium.
A very ambitious schedule and one that leaves me wondering if December of 2016 is the first opportunity for public participation, will notes/discussions from the bi-weekly meetings be published before then?
Probably incorrect but I have the impression from the proposal that documentation is regarded as a contiguous mass of text. Yes?
I ask because the “…contiguous mass of text…” model for documentation is a very poor one.
Documentation can present to a user as though it were a “…contiguous mass of text…,” but as I said, a very poor model for documentation itself.
Imagine R documentation that automatically updates itself from R-Bloggers, for example, to include the latest tutorials on a package.
Or that updates to include new data sets, issued since the last documentation update.
Treating documentation as though it must be episodically static should have been abandoned years ago.
The use of R and R development are not static, why should its documentation be?
From the webpage:
We share R tutorials from scientists at academic and scientific institutions with a goal to give everyone in the world access to a free knowledge. Our tutorials cover different topics including statistics, data manipulation and visualization!
I encountered DataScience+ while running down David Kun’s RDBL post.
As of today, there are 120 tutorials with 451,129 reads.
That’s impressive! Whether you are looking for tutorials or you are looking to post your R tutorial where it will be appreciated.
Enjoy!
RDBL – manipulate data in-database with R code only by David Kun.
From the post:
In this post I introduce our own package RDBL, the R DataBase Layer. With this package you can manipulate data in-database without writing SQL code. The package interprets the R code and sends out the corresponding SQL statements to the database, fully transparently. To minimize overhead, the data is only fetched when absolutely necessary, allowing the user to create the relevant joins (merge), filters (logical indexing) and groupings (aggregation) in R code before the SQL is run on the database. The core idea behind RDBL is to let R users with little or no SQL knowledge to utilize the power of SQL database engines for data manipulation.
It is important to note that the SQL statements generated in the background are not executed unless explicitly requested by the command as.data.frame. Hence, you can merge, filter and aggregate your dataset on the database side and load only the result set into memory for R.
In general the design principle behind RDBL is to keep the models as close as possible to the usual data.frame logic, including (as shown later in detail) commands like aggregate, referencing columns by the \($\) operator and features like logical indexing using the \([]\) operator.
RDBL supports a connection to any SQL-like data source which supports a DBI interface or an ODBC connection, including but not limited to Oracle, MySQL, SQLite, SQL Server, MS Access and more.
…
Not as much fun as surfing mall wifi for logins/passwords, but it is something you can use at work.
The best feature is that you load resulting data sets only. RDBL uses databases for what they do well. Odd but efficient practices do happen from time to time.
I first saw this in a tweet by Christophe Lalanne.
Enjoy!
Carl Schemertmann asks:
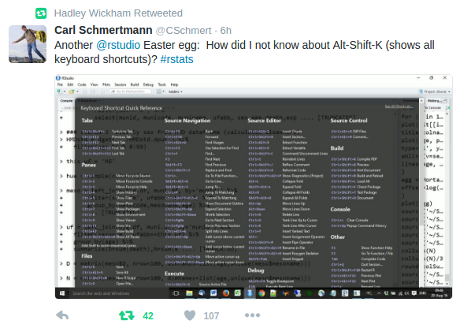
Forty-two people have retweeted Carl’s tweet without answering Carl’s question.
If you have an answer, please reply to Carl. Otherwise, remember:
Alt-Shift-K
shows all keyboard shortcuts in RStudio.
Enjoy!
Well, maybe not everybody but if you are interested in weather statistics, there’s a trio of posts at R-Bloggers made for you.
Trigger Warning: If you are a climate change denier, you won’t like the results presented by the posts cited below. Facts dead ahead.
Tracking Precipitation by Day-of-Year
From the post:
Plotting cumulative day-of-year precipitation can helpful in assessing how the current year’s rainfall compares with long term averages. This plot shows the cumulative rainfall by day-of-year for Philadelphia International Airports rain gauge.
Checking Historical Precipitation Data Quality
From the post:
I am interested in evaluating potential changes in precipitation patterns caused by climate change. I have been working with daily precipitation data for the Philadelphia International Airport, site id KPHL, for the period 1950 to present time using R.
I originally used the Pennsylvania State Climatologist web site to download a CSV file of daily precipitation data from 1950 to the present. After some fits and starts analyzing this data set, I discovered that data for January was missing for the period 1950 – 1969. This data gap seriously limited the usable time record.
John Yagecic, (Adventures In Data) told me about the weatherData package which provides easy to use functions to retrieve Weather Underground data. I have found several precipitation data quality issues that may be of interest to other investigators.
…
Access and Analyze 170 Monthly Climate Time Series Using Simple R Scripts
From the post:
Open Mind, a climate trend data analysis blog, has a great Climate Data Service that provides updated consolidated csv file with 170 monthly climate time series. This is a great resource for those interested in studying climate change. Quick, reliable access to 170 up-to-date climate time series will save interested analysts hundreds – thousands of data wrangling hours of work.
This post presents a simple R script to show how a user can select one of the 170 data series and generate a time series plot like this:
…
All of these posts originated at RClimate, a new blog that focuses on R and climate data.
Drop by to say hello to D Kelly O’Day, PE (professional engineer) Retired.
Relevant searches at R-Bloggers (as of today):
Climate – 218 results
Flood – 61 results
Rainfall – 55 results
Weather – 291 results
Caution: These results contain duplicates.
Enjoy!
Powered by WordPress
