Another Word For It Patrick Durusau on Topic Maps and Semantic Diversity

May 15, 2013

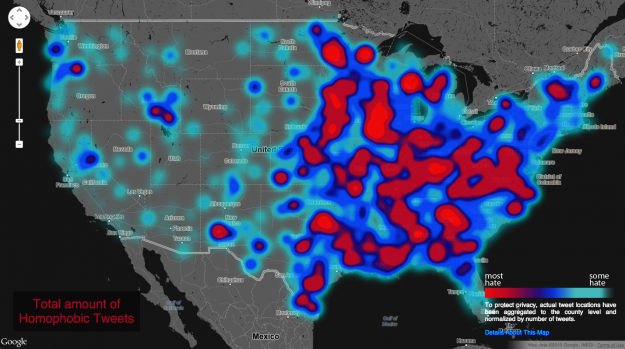
Geography of hate against gays, races, and the disabled

Filed under: Geography,Mapping,Maps — Patrick Durusau @ 3:51 pm

Geography of hate against gays, races, and the disabled by Nathan Yau.

Hate Map

Nathan reports on the work of Floating Sheep who relied on 150,000 tags to create this map.

More details at Nathan’s site but as Nathan says, read the FAQ before you get too torqued about the map.

If nothing else, this should be a good lesson in the choices made collecting and mapping “objective” data (the tweets) and what questions you should ask about that process.

I found it interesting that the sea coast along the Gulf of Mexico seemed to have less hate.

How would you defend the choices you make when making a topic map?

Some information, that is important to someone will have to be left out. Was that out of religious, political, social or ethnic bias?

You can’t avoid that sort of question but you can be comfortable with your own answers should it arise.

My stock response is:

“The paying client is happy with the map. Become a paying client and you can be map happy too.”

May 11, 2013

The Map Myth of Sandy Island

Filed under: Geographic Data,Geography,Mapping,Maps — Patrick Durusau @ 4:39 pm

The Map Myth of Sandy Island by Rebecca Maxwell.

From the post:

Sandy Island has long appeared on maps dating back to the early twentieth century. This island was supposedly located in the Pacific Ocean northwest of Australia in the Coral Sea. It first appeared on an edition of a British admiralty map back in 1908 proving that Sandy Island had been discovered by the French in 1876. Even modern maps, like the General Bathymetic Chart of the Oceans (the British Oceanopgraphic Dat Centre issued an errata about Sandy Island) and Google Earth, show the presence of an island at its coordinates. Sandy Island is roughly the size of Manhattan; it is about three miles wide and fifteen miles long. However, there is only one problem. The island does not actually exist.

Back in October 2012, an Australian research ship undiscovered the island. The ship, called the Southern Surveyor, was led by Maria Seton, a scientist from the University of Sydney. The purpose of the twenty-five-day expedition was to gather information about tectonic activity, map the sea floor, and gather rock samples from the bottom. The scientific data that they had, including the General Bathymetic Chart of the Oceans, indicated the presence of Sandy Island halfway between Australia and the island of New Caledonia, a French possession. The crew began to get suspicious, however, when the chart from the ship’s master only showed open water. Plus, Google Earth only showed a dark blob where it should have been.

When the ship arrived at Sandy Island’s supposed coordinates, they found nothing but ocean a mile deep. One of the ship’s crewmembers, Steven Micklethwaite, said that they all had a good laugh at Google’s expense as they sailed through the island. The crew was quick to make their findings known. The story originally appeared in the Sydney Morning Herald and prompted a large amount of controversy. Cartographers were the most puzzled of all. Many wondered whether the island had ever existed or if it had been eroded away by the ocean waves over the years. Others wondered if the island mysteriously disappeared into the ocean like the legendary city of Atlantis. An “obituary” for Sandy Island, reporting the findings, was published in Eos, Transactions of the Geophysical Union in April of 2013.

Rebecca details the discovered/undiscovered history of Sandy Island in rich detail.

It’s a great story and you should treat yourself by reading it.

My only disagreement with Rebecca comes when she writes:

Maps are continually changing and modern maps still contain a human element that is vulnerable to mistakes.

On the contrary, maps, even modern ones, are wholly human constructs.

Not just the mistakes but the degree of accuracy, the implicit territorial or political claims, what is interesting enough to record, etc., are all human choices in production.

To say nothing of humans on the side of reading/interpretation as well.

If there were no sentient creatures to read it, would a map have any meaning?

May 8, 2013

Largest Coffee Table Book

Filed under: Geographic Data,Geography,Mapping,Maps — Patrick Durusau @ 3:19 pm

Largest Atlas in the World Created using ArcGIS by Caitlin Dempsey.

From the post:

Earth Platinum, the largest atlas ever printed, was released in February 2012 by Millennium House, Australia. Only 31 copies of the 330 pound, leather-bound book exist and each are priced at $100,000. The book measures 6ft by 9ft and has been recognized by Chris Sheedy of the Guinness Book of World Records as the largest atlas in existence. The book contains 128 pages and requires at least two hands, or in some case multiple people, to turn the pages.

Earth Platinum has surpassed the previous holder of the world record for largest atlas, the famous Klencke Atlas (which measures about 5′ 9″ by 6′ 3″ when opened). The Klencke Atlas is housed in the Antiquarian Mapping Division of the British Library in London and held the title for largest atlas worldwide from 1660 until the publication of Earth Platinum. Published as a one-off over 350 years ago, the Klencke Atlas is reported to contain all geographical knowledge of that time, just as Earth Platinum does today.

Amazon doesn’t have it listed so I can’t say if you get a discount and/or free shipping or both. 😉

Interesting but only as a publishing oddity.

I would rather have a digital version that is a geographic interface into a general knowledge topic map.

March 30, 2013

gvSIG

gvSIG

I encountered the gvSIG site while tracking down the latest release of i3Geo.

From its mission statement:

The gvSIG project was born in 2004 within a project that consisted in a full migration of the information technology systems of the Regional Ministry of Infrastructure and Transport of Valencia (Spain), henceforth CIT, to free software. Initially, It was born with some objectives according to CIT needs. These objectives were expanded rapidly because of two reasons principally: on the one hand, the nature of free software, which greatly enables the expansion of technology, knowledge, and lays down the bases on which to establish a community, and, on the other hand, a project vision embodied in some guidelines and a plan appropriate to implement it.

Some of the software projects you will find at gvSIG are:

gvSIG Desktop

gvSIG is a Geographic Information System (GIS), that is, a desktop application designed for capturing, storing, handling, analyzing and deploying any kind of referenced geographic information in order to solve complex management and planning problems. gvSIG is known for having a user-friendly interface, being able to access the most common formats, both vector and raster ones. It features a wide range of tools for working with geographic-like information (query tools, layout creation, geoprocessing, networks, etc.), which turns gvSIG into the ideal tool for users working in the land realm.

gvSIG Mobile

gvSIG Mobile is a Geographic Information System (GIS) aimed at mobile devices, ideal for projects that capture and update data in the field. It’s known for having a user-friendly interface, being able to access the most common formats and a wide range of GIS and GPS tools which are ideal for working with geographic information.

gvSIG Mobile aims at broadening gvSIG Desktop execution platforms to a range of mobile devices, in order to give an answer to the needings of a growing number of mobile solutions users, who wish to use a GIS on different types of devices.

So far, gvSIG Mobile is a Geographic Information System, as well as a Spatial Data Infrastructures client for mobile devices. Such a client is also the first one licensed under open source.

I3Geo

i3Geo is an application for the development of interactive web maps. It integrates several open source applications into a single development platform, mainly Mapserver and OpenLayers. Developed in PHP and Javascript, it has functionalities that allows the user to have better control over the map output, allowing to modify the legend of layers, to apply filters, to perform analysis, etc.

i3Geo is completely customizable and can be tailor to the different users using the interactive map. Furthermore, the spatial data is organized in a catalogue that offers online access services such as WMS, WFS, KML or the download of files.

i3Geo was developed by the Ministry of the Environment of Brazil and it is actually part of the Brazilian Public Software Portal.

gvSIG Educa

What is gvSIG Educa?

“If I can’t picture it, I can’t understand it (A. Einstein)”

gvSIG Educa is a customization of the gvSIG Desktop Open Source GIS, adapted as a tool for the education of issues that have a geographic component.

The aim of gvSIG Educa is to provide educators with a tool that helps students to analyse and understand space, and which can be adapted to different levels or education systems.

gvSIG Educa is not only useful for the teaching of geographic material, but can also be used for learning any subject that contains a spatial component such as history, economics, natural science, sociology…

gvSIG Educa facilitates learning by letting students interact with the information, by adding a spatial component to the study of the material, and by facilitating the assimilation of concepts through visual tools such as thematic maps.

gvSIG Educa provides analysis tools that help to understand spatial relationships.

Definitely a site to visit if you are interested in open source GIS software and/or projects.
i3Geo

Filed under: Geographic Data,Geographic Information Retrieval,Geography,GIS,Mapping,Maps — Patrick Durusau @ 1:08 pm

i3Geo

From the homepage:

i3Geo is an application for the development of interactive web maps. It integrates several open source applications into a single development platform, mainly Mapserver and OpenLayers. Developed in PHP and Javascript, it has functionalities that allows the user to have better control over the map output, allowing to modify the legend of layers, to apply filters, to perform analysis, etc.

i3Geo is completely customizable and can be tailor to the different users using the interactive map. Furthermore, the spatial data is organized in a catalogue that offers online access services such as WMS, WFS, KML or the download of files.

i3Geo was developed by the Ministry of the Environment of Brazil and it is actually part of the Brazilian Public Software Portal.

I followed an announcement about i3Geo 4.7 being available when the line “…an application for the development of interactive web maps,” caught my eye.

Features include:

  • Basic display: fix zoom, zoom by rectangle, panning, etc.
  • Advanced display: locator by attribute, zoom to point, zoom by geographical area, zoom by selection, zoom to layer
  • Integrated display: Wikipedia, GoogleMaps, Panoramio and Confluence
  • Integration with the OpenLayers, GoogleMaps and GoogleEarth APIs
  • Loading of WMS, KML, GeoRSS, shapefile, GPX and CSV layers
  • Management of independent databases
  • Layer catalog management system
  • Management of layers in maps: Change of the layers order, opacity change, title change, filters, thematic classification, legend and symbology changing
  • Analysis tools: buffers, regular grids, points distribution analysis, layer intersection, centroid calculation, etc.
  • Digitalization: vector editing that allows to create new geometries or edit xisting data.
  • Superposition of existing data at the data of the Google Maps and GoogleEarth catalogs.

Unless you want to re-invent mapping software, this could be quite useful for location relevant topic map data.

I first saw this at New final version of i3Geo available: i3Geo 4.7.

January 22, 2013

User evaluation of automatically generated keywords and toponyms… [of semantic gaps]

User evaluation of automatically generated keywords and toponyms for geo-referenced images by Frank O. Ostermann, Martin Tomko, Ross Purves. (Ostermann, F. O., Tomko, M. and Purves, R. (2013), User evaluation of automatically generated keywords and toponyms for geo-referenced images. J. Am. Soc. Inf. Sci.. doi: 10.1002/asi.22738)

Abstract:

This article presents the results of a user evaluation of automatically generated concept keywords and place names (toponyms) for geo-referenced images. Automatically annotating images is becoming indispensable for effective information retrieval, since the number of geo-referenced images available online is growing, yet many images are insufficiently tagged or captioned to be efficiently searchable by standard information retrieval procedures. The Tripod project developed original methods for automatically annotating geo-referenced images by generating representations of the likely visible footprint of a geo-referenced image, and using this footprint to query spatial databases and web resources. These queries return raw lists of potential keywords and toponyms, which are subsequently filtered and ranked. This article reports on user experiments designed to evaluate the quality of the generated annotations. The experiments combined quantitative and qualitative approaches: To retrieve a large number of responses, participants rated the annotations in standardized online questionnaires that showed an image and its corresponding keywords. In addition, several focus groups provided rich qualitative information in open discussions. The results of the evaluation show that currently the annotation method performs better on rural images than on urban ones. Further, for each image at least one suitable keyword could be generated. The integration of heterogeneous data sources resulted in some images having a high level of noise in the form of obviously wrong or spurious keywords. The article discusses the evaluation itself and methods to improve the automatic generation of annotations.

An echo of Steve Newcomb’s semantic impedance appears at:

Despite many advances since Smeulders et al.’s (2002) classic paper that set out challenges in content-based image retrieval, the quality of both nonspecialist text-based and content-based image retrieval still appears to lag behind the quality of specialist text retrieval, and the semantic gap, identified by Smeulders et al. as a fundamental issue in content-based image retrieval, remains to be bridged. Smeulders defined the semantic gap as

the lack of coincidence between the information that one can extract from the visual data and the interpretation that the same data have for a user in a given situation. (p. 1353)

In fact, text-based systems that attempt to index images based on text thought to be relevant to an image, for example, by using image captions, tags, or text found near an image in a document, suffer from an identical problem. Since text is being used as a proxy by an individual in annotating image content, those querying a system may or may not have similar worldviews or conceptualizations as the annotator. (emphasis added)

That last sentence could have come out of a topic map book.

Curious what you make of the author’s claim that spatial locations provide an “external context” that bridges the “semantic gap?”

If we all use the same map of spatial locations, are you surprised by the lack of a “semantic gap?”

January 15, 2013

Maps in R: Plotting data points on a map

Filed under: Geographic Data,Geography,Mapping,Maps,R — Patrick Durusau @ 8:30 pm

Maps in R: Plotting data points on a map by Max Marchi.

From the post:

In the introductory post of this series I showed how to plot empty maps in R.

Today I’ll begin to show how to add data to R maps. The topic of this post is the visualization of data points on a map.

Max continues this series with datasets from airports in Europe and demonstrates how to map the airports to geographic locations. He also represents the airports with icons that correspond to their traffic statistics.

Useful principles for any data set with events that can be plotted against geographic locations.

Parades, patrols, convoys, that sort of thing.

December 30, 2012

TopoJSON

Filed under: Geographic Data,Geography,Mapping,Maps — Patrick Durusau @ 8:34 pm

TopoJSON

From the webpage:

TopoJSON is an extension of GeoJSON that encodes topology. Rather than representing geometries discretely, geometries in TopoJSON files are stitched together from shared line segments called arcs. TopoJSON eliminates redundancy, offering much more compact representations of geometry than with GeoJSON; typical TopoJSON files are 80% smaller than their GeoJSON equivalents. In addition, TopoJSON facilitates applications that use topology, such as topology-preserving shape simplification, automatic map coloring, and cartograms.

I stumbled on this by viewing TopoJSON Points.

Displaying airports in the example but could be any geographic feature.

See the wiki for more details.

December 14, 2012

Sitegeist:…

Filed under: Geographic Data,Geographic Information Retrieval,Geography — Patrick Durusau @ 10:58 am

Sitegeist: A mobile app that tells you about your data surroundings by Nathan Yau.

Nathan writes:

From businesses to demographics, there’s data for just about anywhere you are. Sitegeist, a mobile application by the Sunlight Foundation, puts the sources into perspective.

App is free and the Sunlight site lists the following data for a geographic location:

  • Age Distribution
  • Political Contributions
  • Average Rent
  • Popular Local Spots
  • Recommended Restaurants
  • How People Commute
  • Record Temperatures
  • Housing Units Over Time

If you have an iPhone or Android phone, can you report if other data is available?

I was thinking along the lines of:

  • # of drug arrests
  • # type of drug arrests
  • # of arrests for soliciting (graphed by day/time)
  • # location of bail bond agencies

More tourist type information. 😉

How would you enhance this data flow with a topic map?

November 19, 2012

Georeferencer: Crowdsourced Georeferencing for Map Library Collections

Georeferencer: Crowdsourced Georeferencing for Map Library Collections by Christopher Fleet, Kimberly C. Kowal and Petr Přidal.

Abstract:

Georeferencing of historical maps offers a number of important advantages for libraries: improved retrieval and user interfaces, better understanding of maps, and comparison/overlay with other maps and spatial data. Until recently, georeferencing has involved various relatively time-consuming and costly processes using conventional geographic information system software, and has been infrequently employed by map libraries. The Georeferencer application is a collaborative online project allowing crowdsourced georeferencing of map images. It builds upon a number of related technologies that use existing zoomable images from library web servers. Following a brief review of other approaches and georeferencing software, we describe Georeferencer through its five separate implementations to date: the Moravian Library (Brno), the Nationaal Archief (The Hague), the National Library of Scotland (Edinburgh), the British Library (London), and the Institut Cartografic de Catalunya (Barcelona). The key success factors behind crowdsourcing georeferencing are presented. We then describe future developments and improvements to the Georeferencer technology.

If your institution has a map collection or if you are interested in maps at all, you need to read this article.

There is an introduction video if you prefer: http://www.klokantech.com/georeferencer/.

Either way, you will be deeply impressed by this project.

And wondering: Can the same lessons be applied to crowd source the creation of topic maps?

October 30, 2012

The one million tweet map

Filed under: Geography,Mapping,Maps,Tweets — Patrick Durusau @ 2:43 pm

The one million tweet map

Displays the last one million tweets by geographic location, plus the top five (5) hashtags.

So tweets are not just 140 or less character strings, they are locations as well. Wondering how far you can take re-purposing of a tweet?

Powered by Maptimize.

I first saw this at Mashable.com.

BTW, I don’t find the Adobe Social ad (part of the video at Mashable) all that convincing.

You?

October 20, 2012

Sneak Peek into Skybox Imaging’s Cloudera-powered Satellite System [InaaS?]

Filed under: BigData,Cloudera,Geographic Data,Geography,Intelligence — Patrick Durusau @ 3:02 pm

Sneak Peek into Skybox Imaging’s Cloudera-powered Satellite System by Justin Kestelyn (@kestelyn)

This is a guest post by Oliver Guinan, VP Ground Software, at Skybox Imaging. Oliver is a 15-year veteran of the internet industry and is responsible for all ground system design, architecture and implementation at Skybox.

One of the great promises of the big data movement is using networks of ubiquitous sensors to deliver insights about the world around us. Skybox Imaging is attempting to do just that for millions of locations across our planet.

Skybox is developing a low cost imaging satellite system and web-accessible big data processing platform that will capture video or images of any location on Earth within a couple of days. The low cost nature of the satellite opens the possibility of deploying tens of satellites which, when integrated together, have the potential to image any spot on Earth within an hour.

Skybox satellites are designed to capture light in the harsh environment of outer space. Each satellite captures multiple images of a given spot on Earth. Once the images are transferred from the satellite to the ground, the data needs to be processed and combined to form a single image, similar to those seen within online mapping portals.

With any sensor network, capturing raw data is only the beginning of the story. We at Skybox are building a system to ingest and process the raw data, allowing data scientists and end users to ask arbitrary questions of the data, then publish the answers in an accessible way and at a scale that grows with the number of satellites in orbit. We selected Cloudera to support this deployment.

Now is the time to start planning topic map based products that can incorporate this type of data.

There are lots of folks who are “curious” about what is happening next door, in the next block, a few “klicks” away, across the border, etc.

Not all of them have the funds for private “keyhole” satellites and vacuum data feeds. But they may have money to pay you for efficient and effective collation of intelligence data.

Topic maps empowering “Intelligence as a Service (InaaS)”?

October 11, 2012

Conflict History: All Human Conflicts on a Single Map [Battle of Jericho -1399-04-20?]

Filed under: Geography,History,Mapping,Maps — Patrick Durusau @ 3:44 pm

Conflict History: All Human Conflicts on a Single Map

From the post:

Conflict History [conflicthistory.com], developed by TecToys, summarizes all major human conflicts onto a single world map – from the historical wars way before the birth of Christ, until the drone attacks in Pakistan that are still happening today. The whole interactive map is build upon data retrieved from Google and Freebase open data services.

The world map is controlled by an interactive timeline. An additional search box allows more focused exploration by names or events, while individual conflict titles or icons can be selected to reveal more detailed information, all geographically mapped.

I had to run it back a good ways before I could judge its coverage.

I am not sure about the Battle of Jericho occurring on 04-20 in 1399 BCE. That seems a tad precise.

Still, it is an interesting demonstration of mapping technology.

For Eurocentric points, can you name the longest continuous period of peace (according to European historians)?

September 16, 2012

In Defense of the Power of Paper [Geography of Arguments/Information]

Filed under: Geography,Mapping,Maps,Marketing — Patrick Durusau @ 10:33 am

In her recent editorial, In Defense of the Power of Paper, Phyllis Korkk quotes Richard H. R. Harper saying:

Reading a long document on paper rather than on a computer screen helps people “better understand the geography of the argument contained within,” said Richard H. R. Harper, a principal researcher for Microsoft in Cambridge, England, and co-author with Abigail J. Sellen of “The Myth of the Paperless Office,” published in 2001.

Today’s workers are often navigating through multiple objects in complex ways and creating new documents as well, Mr. Harper said. Using more than one computer screen can be helpful for all this cognitive juggling. But when workers are going back and forth between points in a longer document, it can be more efficient to read on paper, he said. (emphasis added)

To “…understand the geography of the argument….”

I rather like that.

For all the debates about pointing, response codes, locators, identifiers, etc., on the web, all that was every at stake was document as blob.

Our “document as blob” schemes missed:

  • Complex complex relationships between documents
  • Tracking influences on both authors and readers
  • Their continuing but changing roles in the social life of information, and
  • The geography of arguments they contain (with at least as much complexity as documents as blobs).

Others may not be interested in the geography of arguments/information in your documents.

What about you?

Topic maps can help you break the “document as blob” barrier.

With topic maps you can plot the geography of/in your documents.

Interested?

« Newer Posts

Powered by WordPress