Another Word For It Patrick Durusau on Topic Maps and Semantic Diversity

May 4, 2015

Montage Mosaics The Pillars Of Creation!

Filed under: Astroinformatics — Patrick Durusau @ 10:56 am

Montage Mosaics The Pillars Of Creation!

From the post:

The Pillars of Creation in the Eagle Nebula (M16) remain one of the iconic images of the Hubble Space Telescope. Three pillars rise from a molecular cloud into an enormous HII region, powered by the massive young cluster NGC 6611. Such pillars are common in regions of massive star formation, where they form as a result of ionization and stellar winds.

In a paper that will shortly be published in MNRAS, entitled “The Pillars of Creation revisited with MUSE: gas kinematics and high-mass stellar feedback traced by optical spectroscopy,” McLeod et al (2015) analyze of new data acquired with the Multi Unit Spectroscopy Explorer (MUSE) instrument on the VLT. They used Montage to create integrated line maps of the single pointings obtained at the telescope. The figure below shows an example of these maps:

M16-1

The images were too spectacular to pass without reposting.

Also a reminder that “national security” posturing has all the significance of a peacock spreading its feathers. Of interest to other peacocks, possibly female ones, not of much interest to anyone else.

peacock

It’s too bad that Hieronymus Bosch isn’t still around. I can easily imagine him painting “The Garden of Paranoid Delights,” for the security establishment.

April 18, 2015

Deep Space Navigation With Deep Learning

Filed under: Astroinformatics,Deep Learning — Patrick Durusau @ 7:04 pm

Well, that’s not exactly the title but the paper does describe a better than 99% accuracy when compared to human recognition of galaxy images by type. I assume galaxy type is going to be a question on deep space navigation exams in the distant future. 😉

Rotation-invariant convolutional neural networks for galaxy morphology prediction by Sander Dieleman, Kyle W. Willett, Joni Dambre.

Abstract:

Measuring the morphological parameters of galaxies is a key requirement for studying their formation and evolution. Surveys such as the Sloan Digital Sky Survey (SDSS) have resulted in the availability of very large collections of images, which have permitted population-wide analyses of galaxy morphology. Morphological analysis has traditionally been carried out mostly via visual inspection by trained experts, which is time-consuming and does not scale to large (≳104) numbers of images.

Although attempts have been made to build automated classification systems, these have not been able to achieve the desired level of accuracy. The Galaxy Zoo project successfully applied a crowdsourcing strategy, inviting online users to classify images by answering a series of questions. Unfortunately, even this approach does not scale well enough to keep up with the increasing availability of galaxy images.

We present a deep neural network model for galaxy morphology classification which exploits translational and rotational symmetry. It was developed in the context of the Galaxy Challenge, an international competition to build the best model for morphology classification based on annotated images from the Galaxy Zoo project.

For images with high agreement among the Galaxy Zoo participants, our model is able to reproduce their consensus with near-perfect accuracy (>99%) for most questions. Confident model predictions are highly accurate, which makes the model suitable for filtering large collections of images and forwarding challenging images to experts for manual annotation. This approach greatly reduces the experts’ workload without affecting accuracy. The application of these algorithms to larger sets of training data will be critical for analysing results from future surveys such as the LSST.

I particularly like the line:

Confident model predictions are highly accurate, which makes the model suitable for filtering large collections of images and forwarding challenging images to experts for manual annotation.

It reminds me of a suggestion I made for doing something quite similar where the uncertainly of crowd classifiers on a particular letter (as in a manuscript) would trigger the forwarding of that portion to an expert for a “definitive” read. You would surprised at the resistance you can encounter to the suggestion that no special skills are needed to read Greek manuscripts, which are in many cases as clear as when they were written in the early Christian era. Some aren’t and some aspects of them require expertise, but that isn’t to say they all require expertise.

Of course, if successful, such a venture could quite possibly result in papers that cite the images of all extant biblical witnesses and all of the variant texts, as opposed to those that cite a fragment entrusted to them for publication. The difference being whether you want to engage in scholarship, the act of interpreting witnesses or whether you wish to tell the proper time and make a modest noise while doing so.

April 16, 2015

Hunting Changes in Complex Networks (Changes in Networks)

Filed under: Astroinformatics,Graphs,Networks — Patrick Durusau @ 6:54 pm

While writing the Methods for visualizing dynamic networks post, I remembered a technique that the authors didn’t discuss.

What if only one node in a complex network was different? That is all of the other nodes and edges remained fixed while one node and it edges changed? How easy would that be to visualize?

If that sounds like an odd use case, it’s not. In fact, the discovery of Pluto in the 1930’s was made using a blink comparator exactly for that purpose.

blink

This is Cyrus Tombaugh using a blink comparator which shows the viewer two images, quickly alternating between them. The images are of the same parts of the night sky and anything that has changed with be quickly noticed by the human eye.

plutodisc_noarrows

Select the star field image to get a larger view and the gif will animate as though seen through a blink comparator. Do you see Pluto? (These are images of the original discovery plates.)

If not, see these http://upload.wikimedia.org/wikipedia/en/c/c6/Pluto_discovery_plates.pngplates with Pluto marked by a large arrow in each one.

This wonderful material on Pluto came from: Beyond the Planets – the discovery of Pluto

All of that was to interest you in reading: GrepNova: A tool for amateur supernova hunting by Frank Dominic.

From the article:

This paper presents GrepNova, a software package which assists amateur supernova hunters by allowing new observations of galaxies to be compared against historical library images in a highly automated fashion. As each new observation is imported, GrepNova automatically identifies a suitable comparison image and rotates it into a common orientation with the new image. The pair can then be blinked on the computer’s display to allow a rapid visual search to be made for stars in outburst. GrepNova has been in use by Tom Boles at his observatory in Coddenham, Suffolk since 2005 August, where it has assisted in the discovery of 50 supernovae up to 2011 October.

That’s right, these folks are searching for supernovas in other galaxies, each of which consists of millions of stars, far denser than most contact networks.

The download information for GrepNova has changed since the article was published: https://in-the-sky.org/software.php.

I don’t have any phone metadata to try the experiment on but with a graph of contacts, the usual contacts will simply be background and new contacts will jump off the screen at you.

A great illustration of why prior searching techniques remain relevant to modern “information busy” visualizations.

April 12, 2015

US, Chile to ‘officially’ kick off LSST construction

Filed under: Astroinformatics,BigData — Patrick Durusau @ 5:01 pm

US, Chile to ‘officially’ kick off LSST construction

From the post:

From distant exploding supernovae and nearby asteroids to the mysteries of dark matter, the Large Synoptic Survey Telescope (LSST) promises to survey the night skies and provide data to solve the universe’s biggest mysteries. On April 14, news media are invited to join the U.S. National Science Foundation (NSF), the U.S. Department of Energy (DoE) and other public-private partners as they gather outside La Serena, Chile, to “officially” launch LSST’s construction in a traditional Chilean stone-laying ceremony.

LSST is an 8.4-meter, wide-field survey telescope that will image the entire visible sky a few times a week for 10 years. It is located in Cerro Pachón, a mountain peak in northern Chile, chosen for its clear air, low levels of light pollution and dry climate. Using a 3-billion pixel camera–the largest digital camera in the world–and a unique three-mirror construction, it will allow scientists to see a vast swath of sky, previously impervious to study.

The compact construction of LSST will enable rapid movement, allowing the camera to observe fleeting, rare astronomical events. It will detect and catalogue billions of objects in the universe, monitoring them over time and will provide this data–more than 30 terabytes each night–to astronomers, astrophysicists and the interested public around the world. Additionally, the digital camera will shed light on dark energy, which scientists have determined is accelerating the universe’s expansion. It will probe further into the mystery of dark energy, creating a unique dataset of billions of galaxies.

It’s not coming online tomorrow, first light in 2019 and full operation in 2022, but its not too early to start thinking about how to process such a flood of data. Astronomers have been working on those issues for some time so if you are looking for new ways to think about processing data, don’t forget to check with the astronomy department.

Even by today’s standards, thirty (30) terabytes of data a night is a lot of data.

Enjoy!

April 9, 2015

Building upon the Current Capabilities of WWT

Filed under: Astroinformatics,Science — Patrick Durusau @ 6:09 pm

Building upon the Current Capabilities of WWT

From the post:

WWT to GitHub

WorldWide Telescope is a complex system that supports a wide variety of research, education and outreach activities.  By late 2015, the Windows and HTML5/JavaScript code needed to run WWT will be available in a public (Open Source) GitHub repository. As code moves through the Open Sourcing process during 2015, the OpenWWT web site (www.openwwt.org) will offer updated details appropriate for a technical audience, and contact links for additional information.

Leveraging and Extending WorldWide Telescope

The open WorldWide Telescope codebase will provide new ways of leveraging and extending WWT functionality in the future.  WWT is already friendly to data and reuse thanks to its extant software development kits, and its ability to import data through both the user interface and “WTML” (WWT’s XML based description language to add data into WWT).  The short listing below gives some examples of how data can be accessed, displayed, and explained using WWT as it presently is. Most of these capabilities are demonstrated quickly in the “What Can WorldWide Telescope Do for Me?” video at tinyurl.com/wwt-for-me. The www.worldwidetelescope.org/Developers/ site offers resources useful to developers, and details beyond those offered below.

Creating Tours

What you can do: You can create a variety of tours with WWT. The tour-authoring interface allows tour creators to guide tour viewers through the Universe by positioning a virtual camera in various slides, and WWT animates the between-slide transitions automatically. Tour creators can also add their own images, data, text, music, voice over and other media to enhance the message. Buttons, images and other elements can link to other Tours, ultimately allowing tour viewers to control their own paths. Tour functionality can be used to create Kiosks, menu-driven multimedia content, presentations, training and quizzing interactives and self-service data exploration. In addition to their educational value, tours can be particularly useful in collaborative research projects, where researchers can narrate and/or annotate various views of data.  Tour files are typically small enough to be exchanged easily by email or cloud services. Tours that follow a linear storyline can also be output to high quality video frames for professional quality video production at any resolution desired. Tours can also be hosted in a website to create interactive web content.

Skills Required: WWT tours are one of the most powerful aspects of WWT, and creating them doesn’t require any programing skills. You should know what story you want to tell and understand presentation and layout skills. If you can make a PowerPoint presentation then you should be able to make a WWT tour.  The WorldWide Telescope Ambassadors (outreach-focused) website provides a good sample of Tours, at wwtambassadors.org/tours, and a good tour to experience to see the largest number of tour features in use all at once is “John Huchra’s Universe,” at wwtambassadors.org/john-huchras-universe.  A sample tour-based kiosk is online at edukiosks.harvard.edu.  A video showing a sample research tour (meant for communication with collaborators) is at tinyurl.com/morenessies.

That is just a sample of the news from the WorldWide Telescope!

The popular press keeps bleating about “big data.” Some of which will be useful, some of which will not. But imagine a future when data from all scientific experiments supported by the government are streamed online at the time of acquisition. It won’t be just “big data” but rather “data that makes a difference.” As the decades of data accumulates, synthetic analysis can be performed on all the available data, not just the snippet that you were able to collect.

Hopefully even private experiments will be required to contribute their data as well. Facts are facts and not subject to ownership. Private entities could produce products subject to patents but knowledge itself should be patent free.

March 16, 2015

ADS: The Next Generation Search Platform

Filed under: Astroinformatics,Bibliography,Searching — Patrick Durusau @ 6:28 pm

ADS: The Next Generation Search Platform by Alberto Accomazzi et al.

Abstract:

Four years after the last LISA meeting, the NASA Astrophysics Data System (ADS) finds itself in the middle of major changes to the infrastructure and contents of its database. In this paper we highlight a number of features of great importance to librarians and discuss the additional functionality that we are currently developing. Starting in 2011, the ADS started to systematically collect, parse and index full-text documents for all the major publications in Physics and Astronomy as well as many smaller Astronomy journals and arXiv e-prints, for a total of over 3.5 million papers. Our citation coverage has doubled since 2010 and now consists of over 70 million citations. We are normalizing the affiliation information in our records and, in collaboration with the CfA library and NASA, we have started collecting and linking funding sources with papers in our system. At the same time, we are undergoing major technology changes in the ADS platform which affect all aspects of the system and its operations. We have rolled out and are now enhancing a new high-performance search engine capable of performing full-text as well as metadata searches using an intuitive query language which supports fielded, unfielded and functional searches. We are currently able to index acknowledgments, affiliations, citations, funding sources, and to the extent that these metadata are available to us they are now searchable under our new platform. The ADS private library system is being enhanced to support reading groups, collaborative editing of lists of papers, tagging, and a variety of privacy settings when managing one’s paper collection. While this effort is still ongoing, some of its benefits are already available through the ADS Labs user interface and API at this http URL

Now for a word from the people who were using “big data” before it was a buzz word!

The focus here is on smaller data, publications, but it makes a good read.

I have been following the work on Solr proper and am interested in learning more about the extensions created to Solr by ADS.

Enjoy!

I first saw this in a tweet by Kirk Borne.

February 18, 2015

The Revolution in Astronomy Education: Data Science for the Masses

Filed under: Astroinformatics,Data Science,Education — Patrick Durusau @ 12:42 pm

The Revolution in Astronomy Education: Data Science for the Masses
by Kirk D. Borne, et al.

Abstract:

As our capacity to study ever-expanding domains of our science has increased (including the time domain, non-electromagnetic phenomena, magnetized plasmas, and numerous sky surveys in multiple wavebands with broad spatial coverage and unprecedented depths), so have the horizons of our understanding of the Universe been similarly expanding. This expansion is coupled to the exponential data deluge from multiple sky surveys, which have grown from gigabytes into terabytes during the past decade, and will grow from terabytes into Petabytes (even hundreds of Petabytes) in the next decade. With this increased vastness of information, there is a growing gap between our awareness of that information and our understanding of it. Training the next generation in the fine art of deriving intelligent understanding from data is needed for the success of sciences, communities, projects, agencies, businesses, and economies. This is true for both specialists (scientists) and non-specialists (everyone else: the public, educators and students, workforce). Specialists must learn and apply new data science research techniques in order to advance our understanding of the Universe. Non-specialists require information literacy skills as productive members of the 21st century workforce, integrating foundational skills for lifelong learning in a world increasingly dominated by data. We address the impact of the emerging discipline of data science on astronomy education within two contexts: formal education and lifelong learners.

Kirk Borne posted a tweet today about this paper with following graphic:

turning-people

I deeply admire the work that Kirk has done, is doing and hopefully will continue to do, but is the answer really that simple? That is we need to provide people with “…great tools written by data scientists?”

As an example of what drives my uncertainty, I saw a presentation a number of years ago in biblical studies that involved statistical analysis and when the speaker was asked by a particular result was significant, the response was the manual said that it was. Ouch!

On the other hand, it may be that like automobiles, we have to accept a certain level of accidents/injuries/deaths as a cost of making such tools widely available.

Should we acknowledge up front that a certain level of mis-use, poor use, inappropriate use of “great tools written by data scientists” is a cost of making data and data tools available?

PS: I am leaving to one side cases where tools have been deliberately fashioned to reach false or incorrect results. Detecting those cases might challenge seasoned data scientists.

February 16, 2015

Visualizing Interstellar ‘s Wormhole

Filed under: Astroinformatics,Physics — Patrick Durusau @ 4:19 pm

Visualizing Interstellar’s Wormhole by Oliver James, Eugenie von Tunzelmann, Paul Franklin, Kip S. Thorne.

Abstract:

Christopher Nolan’s science fiction movie Interstellar offers a variety of opportunities for students in elementary courses on general relativity theory. This paper describes such opportunities, including: (i) At the motivational level, the manner in which elementary relativity concepts underlie the wormhole visualizations seen in the movie. (ii) At the briefest computational level, instructive calculations with simple but intriguing wormhole metrics, including, e.g., constructing embedding diagrams for the three-parameter wormhole that was used by our visual effects team and Christopher Nolan in scoping out possible wormhole geometries for the movie. (iii) Combining the proper reference frame of a camera with solutions of the geodesic equation, to construct a light-ray-tracing map backward in time from a camera’s local sky to a wormhole’s two celestial spheres. (iv) Implementing this map, for example in Mathematica, Maple or Matlab, and using that implementation to construct images of what a camera sees when near or inside a wormhole. (v) With the student’s implementation, exploring how the wormhole’s three parameters influence what the camera sees—which is precisely how Christopher Nolan, using our implementation, chose the parameters for \emph{Interstellar}’s wormhole. (vi) Using the student’s implementation, exploring the wormhole’s Einstein ring, and particularly the peculiar motions of star images near the ring; and exploring what it looks like to travel through a wormhole.

Finally! A use for all the GFLOPS at your finger tips! You can vet images shown in movies that purport to represent wormholes. Seriously, the appendix to this article has instructions.

Moreover, you can visit: Visualizing Interstellar’s Wormhole (I know, same name as the paper but this is a website with further details and high-resolution images for use by students.)

A poor cropped version of one of those images:

interstellar

A great demonstration of what awaits anyone with an interest to explore and sufficient computing power.

I first saw this in a tweet by Computer Science.

February 9, 2015

Working Group on Astroinformatics and Astrostatistics (WGAA)

Filed under: Astroinformatics,BigData — Patrick Durusau @ 7:53 pm

Working Group on Astroinformatics and Astrostatistics (WGAA)

From the webpage:

History: The WG was established at the 220th Meeting, June 2012 in Anchorage in response to a White Paper report submitted to the Astro2010 Decadal Survey.

Members: Any AAS member with an interest in these fields is invited to join.

Steering Committee: ~10 members including the chair; initially appointed by Council and in successive terms, nominated by the Working Group and confirmed by the AAS Council

Term: Three years staggered, with terms beginning and ending at the close of the Annual Summer Meeting. Members may be re-appointed.

Chair: Initially appointed by Council after consultation with the inaugural WG members. In successive terms, nominated by the Working Group; confirmed by the AAS Council.

Charge: The Working Group is charged with developing and spreading awareness of the applications of advanced computer science, statistics and allied branches of applied mathematics to further the goals of astronomical and astrophysical research.

The Working Group may interact with other academic, international, or governmental organizations, as appropriate, to advance the fields of astroinformatics and astrostatistics. It must report to Council annually on its activities, and is encouraged to make suggestions and proposals to the AAS leadership on ways to enhance the utility and visibility of its activities.

Astroinformatics and astronstatistics, modern astronomy in general, doesn’t have small data. All of its data is “Big Data.”

Members of your data team should select not-your-domain groups to monitor for innovations and new big data techniques.

I first saw this in a tweet by Kirk Borne.

PS: Kirk added a link to the paper that resulted in this group: Astroinformatics: A 21st Century Approach to Astronomy.

January 26, 2015

Chandra Celebrates the International Year of Light

Filed under: Astroinformatics,News,Science — Patrick Durusau @ 8:53 pm

Chandra Celebrates the International Year of Light by Janet Anderson and Megan Watzke.

From the webpage:

The year of 2015 has been declared the International Year of Light (IYL) by the United Nations. Organizations, institutions, and individuals involved in the science and applications of light will be joining together for this yearlong celebration to help spread the word about the wonders of light.

In many ways, astronomy uses the science of light. By building telescopes that can detect light in its many forms, from radio waves on one end of the “electromagnetic spectrum” to gamma rays on the other, scientists can get a better understanding of the processes at work in the Universe.

NASA’s Chandra X-ray Observatory explores the Universe in X-rays, a high-energy form of light. By studying X-ray data and comparing them with observations in other types of light, scientists can develop a better understanding of objects likes stars and galaxies that generate temperatures of millions of degrees and produce X-rays.

To recognize the start of IYL, the Chandra X-ray Center is releasing a set of images that combine data from telescopes tuned to different wavelengths of light. From a distant galaxy to the relatively nearby debris field of an exploded star, these images demonstrate the myriad ways that information about the Universe is communicated to us through light.

Five objects at various distances that have been observed by Chandra

SNR 0519-69.0: When a massive star exploded in the Large Magellanic Cloud, a satellite galaxy to the Milky Way, it left behind an expanding shell of debris called SNR 0519-69.0. Here, multimillion degree gas is seen in X-rays from Chandra (blue). The outer edge of the explosion (red) and stars in the field of view are seen in visible light from Hubble.

Five objects at various distances that have been observed by Chandra

Cygnus A: This galaxy, at a distance of some 700 million light years, contains a giant bubble filled with hot, X-ray emitting gas detected by Chandra (blue). Radio data from the NSF’s Very Large Array (red) reveal “hot spots” about 300,000 light years out from the center of the galaxy where powerful jets emanating from the galaxy’s supermassive black hole end. Visible light data (yellow) from both Hubble and the DSS complete this view.

There are more images but one of the reasons I posted about Chandra is that the online news reports I have seen all omitted the most important information of all: Where to find more information!

At the bottom of this excellent article on Chandra (which also doesn’t appear as a link in the news stories I have read), you will find:

For more information on “Light: Beyond the Bulb,” visit the website at http://lightexhibit.org

For more information on the International Year of Light, go to http://www.light2015.org/Home.html

For more information and related materials, visit: http://chandra.si.edu

For more Chandra images, multimedia and related materials, visit: http://www.nasa.gov/chandra

Granted it took a moment or two to insert the hyperlinks but now any child or teacher or anyone else who wants more information can avoid the churn and chum of searching and go directly to the sources for more information.

That doesn’t detract from my post. On the contrary, I hope that readers find that sort of direct linking to more resources helpful and a reason to return to my site.

Granted I don’t have advertising and won’t so keeping people at my site is no financial advantage to me. But if I have to trap people into remaining at my site, it must not be a very interesting one. Yes?

Machine Learning Etudes in Astrophysics: Selection Functions for Mock Cluster Catalogs

Filed under: Astroinformatics,Classification,Machine Learning — Patrick Durusau @ 3:24 pm

Machine Learning Etudes in Astrophysics: Selection Functions for Mock Cluster Catalogs by Amir Hajian, Marcelo Alvarez, J. Richard Bond.

Abstract:

Making mock simulated catalogs is an important component of astrophysical data analysis. Selection criteria for observed astronomical objects are often too complicated to be derived from first principles. However the existence of an observed group of objects is a well-suited problem for machine learning classification. In this paper we use one-class classifiers to learn the properties of an observed catalog of clusters of galaxies from ROSAT and to pick clusters from mock simulations that resemble the observed ROSAT catalog. We show how this method can be used to study the cross-correlations of thermal Sunya’ev-Zeldovich signals with number density maps of X-ray selected cluster catalogs. The method reduces the bias due to hand-tuning the selection function and is readily scalable to large catalogs with a high-dimensional space of astrophysical features.

From the introduction:

In many cases the number of unknown parameters is so large that explicit rules for deriving the selection function do not exist. A sample of the objects does exist (the very objects in the observed catalog) however, and the observed sample can be used to express the rules for the selection function. This “learning from examples” is the main idea behind classi cation algorithms in machine learning. The problem of selection functions can be re-stated in the statistical machine learning language as: given a set of samples, we would like to detect the soft boundary of that set so as to classify new points as belonging to that set or not. (emphasis added)

Does the sentence:

In many cases the number of unknown parameters is so large that explicit rules for deriving the selection function do not exist.

sound like they could be describing people?

I mention this as a reason why you should be read broadly in machine learning in particular and IR in general.

What if all the known data about known terrorists, sans all the idle speculation by intelligence analysts, were gathered into a data set. Machine learning on that data set could then be tested against a simulation of potential terrorists, to help avoid the biases of intelligence analysts.

Lest the undeserved fixation on Muslims blind security services to other potential threats, such as governments bent on devouring their own populations.

I first saw this in a tweet by Stat.ML.

January 12, 2015

NASA is using machine learning to predict the characteristics of stars

Filed under: Astroinformatics,Machine Learning — Patrick Durusau @ 7:42 pm

NASA is using machine learning to predict the characteristics of stars by Nick Summers.

From the post:

stars1

With so many stars in our galaxy to discover and catalog, NASA is adopting new machine learning techniques to speed up the process. Even now, telescopes around the world are capturing countless images of the night sky, and new projects such as the Large Synoptic Survey Telescope (LSST) will only increase the amount of data available at NASA’s fingertips. To give its analysis a helping hand, the agency has been using some of its prior research and recordings to essentially “teach” computers how to spot patterns in new star data.

NASA’s Jet Propulsion Laboratory started with 9,000 stars and used their individual wavelengths to identify their size, temperature and other basic properties. The data was then cross-referenced with light curve graphs, which measure the brightness of the stars, and fed into NASA’s machines. The combination of the two, combined with some custom algorithms, means that NASA’s computers should be able to make new predictions based on light curves alone. Of course, machine learning isn’t new to NASA, but this latest approach is a little different because it can identify specific star characteristics. Once the LSST is fully operational in 2023, it could reduce the number of astronomers pulling all-nighters.

[Image Credit: Image credit: NASA/JPL-Caltech, Flickr]

Do they have a merit badge in machine learning yet? Thinking that would make a great summer camp project!

Whatever field or hobby you learn machine learning in, the skills can be reused in many others. Good investment.

January 8, 2015

WorldWide Telescope (MS) Goes Open Source!

Filed under: Astroinformatics,Open Source — Patrick Durusau @ 10:15 am

Microsoft is Open‐Sourcing WorldWide Telescope in 2015

From the post:

Why is this great news?

Millions of people rely on WorldWide Telescope (WWT) as their unified astronomical image and data environment for exploratory research, teaching, and public outreach. With OpenWWT, any individual or organization will be able to adapt and extend the functionality of WorldWide Telescope to meet any research or educational need. Extensions to the software will continuously enhance astronomical research, formal and informal learning, and public outreach.

What is WWT, and where did it come from?

WorldWide Telescope began in 2007 as a research project, led from within Microsoft Research. Early partners included astronomers and educators from Caltech, Harvard, Johns Hopkins, Northwestern, the University of Chicago, and several NASA facilities. Thanks to these collaborations and Microsoft’s leadership, WWT has reached its goal of creating a free unified contextual visualization of the Universe with global reach that lets users explore multispectral imagery, all of which is deeply connected to scholarly publications and online research databases.

The WWT software was designed with rich interactivity in mind. Guided tours which can be created within the program, offer scripted paths through the 3D environment, allowing media-rich interactive stories to be told, about anything from star formation to the discovery of the large scale structure of the Universe. On the web, WWT is used as both as a standalone program and as an API, in teaching and in research—where it offers unparalleled options for sharing and contextualizing data sets, on the “2D” multispectral sky and/or within the “3D” Universe.

How can you help?

Open-sourcing WWT will allow the people who can best imagine how WWT should evolve to meet the expanding research and teaching challenges in astronomy to guide and foster future development. The OpenWWT Consortium’s members are institutions who will guide WWT’s transition from Microsoft Research to a new host organization. The Consortium and hosting organization will work with the broader astronomical community on a three-part mission of: 1) advancing astronomical research, 2) improving formal and informal astronomy education; and 3) enhancing public outreach.

Join us. If you and your institution want to help shape the future of WWT to support your needs, and the future of open-source software development in Astronomy, then ask us about joining the OpenWWT Consortium.

To contact the WWT team, or inquire about joining the OpenWWT Consortium, contact Doug Roberts at doug-roberts@northwestern.edu.

What a nice way to start the day!

I’m Twitter follower #30 for OpenWWT. What Twitter follower are you going to be?

If you are interested in astronomy, teaching, interfaces, coding great interfaces, etc., there is something of interest for you here.

Enjoy!

January 6, 2015

NASA’s Kepler Marks 1,000th Exoplanet Discovery…

Filed under: Astroinformatics,Humor,Science — Patrick Durusau @ 3:00 pm

NASA’s Kepler Marks 1,000th Exoplanet Discovery, Uncovers More Small Worlds in Habitable Zones by Felicia Chou and Michele Johnson.

From the post:

15-004_0

NASA Kepler’s Hall of Fame: Of the more than 1,000 verified planets found by NASA’s Kepler Space Telescope, eight are less than twice Earth-size and in their stars’ habitable zone. All eight orbit stars cooler and smaller than our sun. The search continues for Earth-size habitable zone worlds around sun-like stars.

How many stars like our sun host planets like our Earth? NASA’s Kepler Space Telescope continuously monitored more than 150,000 stars beyond our solar system, and to date has offered scientists an assortment of more than 4,000 candidate planets for further study — the 1,000th of which was recently verified.

Using Kepler data, scientists reached this millenary milestone after validating that eight more candidates spotted by the planet-hunting telescope are, in fact, planets. The Kepler team also has added another 554 candidates to the roll of potential planets, six of which are near-Earth-size and orbit in the habitable zone of stars similar to our sun.

Three of the newly-validated planets are located in their distant suns’ habitable zone, the range of distances from the host star where liquid water might exist on the surface of an orbiting planet. Of the three, two are likely made of rock, like Earth.

“Each result from the planet-hunting Kepler mission’s treasure trove of data takes us another step closer to answering the question of whether we are alone in the Universe,” said John Grunsfeld, associate administrator of NASA’s Science Mission Directorate at the agency’s headquarters in Washington. “The Kepler team and its science community continue to produce impressive results with the data from this venerable explorer.”

To determine whether a planet is made of rock, water or gas, scientists must know its size and mass. When its mass can’t be directly determined, scientists can infer what the planet is made of based on its size.

Two of the newly validated planets, Kepler-438b and Kepler-442b, are less than 1.5 times the diameter of Earth. Kepler-438b, 475 light-years away, is 12 percent bigger than Earth and orbits its star once every 35.2 days. Kepler-442b, 1,100 light-years away, is 33 percent bigger than Earth and orbits its star once every 112 days.

Given the distances involved, Kepler-438b and Kepler-442b, at 475 light years and 1,100 light years, respectively, the EU has delayed work on formulating conditions for their admission into the EU until after resolution of the current uncertainty over the Greek bailout agreement. Germany is already circulating draft admission proposals.

January 3, 2015

Astrostatistics and Astroinformatics Portal (ASAIP)

Filed under: Astroinformatics,Science,Statistics — Patrick Durusau @ 7:35 pm

Astrostatistics and Astroinformatics Portal (ASAIP)

From the webpage:

The ASAIP provides searchable abstracts to Recent Papers in the field, several discussion Forums, various resources for researchers, brief Articles by experts, lists of Meetings, and access to various Web resources such as on-line courses, books, jobs and blogs. The site will be used for public outreach by five organizations: International Astrostatistics Association (IAA, to be affiliated with the International Statistical Institute), American Astronomical Society Working Group in Astroinformatics and Astrostatistics (AAS/WGAA), International Astronomical Union Working Group in Astrostatistics and Astroinformatics (IAU/WGAA), Information and Statistical Sciences Consortium of the planned Large Synoptic Survey Telescope (LSST/ISSC), and the American Statistical Association Interest Group in Astrostatistics (ASA/IGA).

Join the ASAIP! Members of ASAIP — researchers and students in astronomy, statistics, computer science and related fields — can contribute to the discussion Forums, submit Recent Papers, Research Group links, and announcements of Meetings. Members login using the box at the upper right; typical login names have the form `jsmith’. To become a member, please email the ASAIP editors.

Optical and radio astronomy had “big data” before “big data” was sexy! If you are looking for data sets to stretch your software, you are in the right place.

Enjoy!

December 21, 2014

The Frontier Fields Lens Models

Filed under: Astroinformatics — Patrick Durusau @ 5:25 pm

The Frontier Fields Lens Models

From the post:

Abell 2744: Overlay of magnification (red) and mass models (blue) on the full-band HST imaging (green)


Bradač et al.

CATS Team

Merten, Zitrin et al.

Sharon et al.

Williams et al.


The Frontier Fields (FF) are selected to be among the strongest lensing clusters on the sky. In order to interpret many of the properties of background lensed galaxies, reliable models of the lensing maps for each cluster are required. Preliminary models for each of the six Frontier Fields clusters have been provided by five independent groups prior to the HST Frontier Fields observing campaign in order to facilitate rapid analysis of the FF data by all members of the community. These models are based upon a common set of input data, including pre-FF archival HST imaging and a common set of lensed galaxies.

The public Frontier Fields lens models include maps of mass (kappa) and shear (gamma) from which magnifications can be derived at any redshift using the script provided. Magnification maps pre-computed at z = {1,2,4,9} are also available for download. The models cover regions constrained by strongly lensed, multiply-imaged galaxies, within the HST ACS fields of view of the cluster cores. The Merten models extend to larger areas, including the FF parallel fields, as they incorporate ground-based weak lensing data. For a description of the methodology adopted by each group, see this webpage, and the links to each map-maker below. Also see this primer on gravitational lensing.

On the off-chance that you did not get the Hubble Space Telescope observing time you wanted as a present, here are models for lensing galaxy clusters. Data is included.

Enjoy!

PS: This is a model for data and processing sharing. A marked contrast with some government agencies.

December 16, 2014

Slooh

Filed under: Astroinformatics — Patrick Durusau @ 3:50 pm

Slooh I want to be an astronaut astronomer.

From the webpage:

Robotic control of Slooh’s three telescopes in the northern (Canary Islands) and southern hemispheres (Chile)

Schedule time and point the telescopes at any object in the night sky. You can make up to five reservations at a time in five or ten minute increments depending on the observatory. There are no limitations on the total number of reservations you can book in any quarter.

Capture, collect, and share images, including PNG and FITS files. You can view and take images from any of the 250+ “missions” per night, including those scheduled by other members.

Watch hundreds of hours of live and recorded space shows with expert narration featuring 10+ years of magical moments in the night sky including eclipses, transits, solar flares, NEA, comets, and more.

See and discuss highlights from the telescopes, featuring member research, discoveries, animations, and more.

Join groups with experts and fellow citizen astronomers to learn and discuss within areas of interest, from astrophotography and tracking asteroids to exoplanets and life in the Universe.

Access Slooh activities with step by step how-to instructions to master the art and science of astronomy.

A reminder that for all the grim data that is available for analysis/mining, there is an equal share of interesting and/or beautiful data as well.

There is a special on right now for $1.00 you can obtain four (4) weeks of membership. The fine print says every yearly quarter of membership is $74.85. $74.85 / 4 = $18.71 per month or $224.25 per year. Less than cable and/or cellphone service. It also has the advantage of not making you dumber. Surprised they didn’t mention that.

I first saw this in a tweet by Michael Peter Edson.

December 9, 2014

A Quick Spin Around the Big Dipper

Filed under: Astroinformatics,Graphs — Patrick Durusau @ 8:10 pm

A Quick Spin Around the Big Dipper by Summer Ash.

From the post:

From our perspective here on Earth, constellations appear to be fixed groups of stars, immobile on the sky. But what if we could change that perspective?

In reality, it’d be close to impossible. We would have to travel tens to hundreds of light-years away from Earth for any change in the constellations to even begin to be noticeable. As of this moment, the farthest we (or any object we’ve made) have traveled is less than one five-hundreth of a light-year.

Just for fun, let’s say we could. What would our familiar patterns look like then? The stars that comprise them are all at different distances from us, traveling around the galaxy at different speeds, and living vastly different lives. Very few of them are even gravitationally bound to each other. Viewed from the side, they break apart into unrecognizable landscapes, their stories of gods and goddesses, ploughs and ladles, exposed as pure human fantasy. We are reminded that we live in a very big place.

Great visualizations.

Summer’s post reminded me of Caleb Jones’ Stellar Navigation Using Network Analysis and how he created 3-D visualizations out to various distances.

By rotating Caleb’s 3-D graphs there would be more stars in the way of your vision but it might also be more realistic.

Just as a thought experiment for the moment, what if you postulated a planet around a distant star and the transparency of the atmosphere for observing distant stars? What new constellations would you see from such a distant world?

Other than speed of travel, what would be the complexities of travel and governance across a sphere of influence of say 1,000 light years? Any natural groupings that might have similar interests?

Enjoy!

December 7, 2014

Stellar Navigation Using Network Analysis

Filed under: Astroinformatics,Graphs,Networks — Patrick Durusau @ 3:14 pm

Stellar Navigation Using Network Analysis by Caleb Jones.

To give you an idea of where this post ends up:

From the post:

This has been the funnest and most challenging network analysis and visualization I have done to date. As I've mentioned before, I am a huge space fan. One of my early childhood fantasies was the idea of flying instantly throughout the universe exploring all the different planets, stars, nebulae, black holes, galaxies, etc. The idea of a (possibly) infinite universe with inexhaustible discoveries to be made has kept my interest and fascination my whole life. I identify with the sentiment expressed by Carl Sagan in his book Pale Blue Dot:

In the last ten thousand years, an instant in our long history, we’ve abandoned the nomadic life. For all its material advantages, the sedentary life has left us edgy, unfulfilled. The open road still softly calls like a nearly forgotten song of childhood. Your own life, or your band’s, or even your species’ might be owed to a restless few—drawn, by a craving they can hardly articulate or understand, to undiscovered lands and new worlds.

Herman Melville, in Moby Dick, spoke for wanderers in all epochs and meridians: “I am tormented with an everlasting itch for things remote. I love to sail forbidden seas…”

Maybe it’s a little early. Maybe the time is not quite yet. But those other worlds— promising untold opportunities—beckon.

Silently, they orbit the Sun, waiting.

Fair warning: If you aren’t already a space enthusiast, this project may well turn you into one!

Distance and relative location are only two (2) facts that are known for stars within eight (8) light-years. What other facts or resources would you connect to the stars in these networks?

December 4, 2014

Hebrew Astrolabe:…

Filed under: Astroinformatics,History,Language — Patrick Durusau @ 9:16 pm

Hebrew Astrolabe: A History of the World in 100 Objects, Status Symbols (1200 – 1400 AD) by Neil MacGregor.

From the webpage:

Neil MacGregor’s world history as told through objects at the British Museum. This week he is exploring high status objects from across the world around 700 years ago. Today he has chosen an astronomical instrument that could perform multiple tasks in the medieval age, from working out the time to preparing horoscopes. It is called an astrolabe and originates from Spain at a time when Christianity, Islam and Judaism coexisted and collaborated with relative ease – indeed this instrument carries symbols recognisable to all three religions. Neil considers who it was made for and how it was used. The astrolabe’s curator, Silke Ackermann, describes the device and its markings, while the historian Sir John Elliott discusses the political and religious climate of 14th century Spain. Was it as tolerant as it seems?

The astrolabe that is the focus of this podcast is quite remarkable. The Hebrew, Arabic and Spanish words on this astrolabe are all written in Hebrew characters.

Would you say that is multilingual?

BTW, this series from the British Museum will not be available indefinitely so start listening to these podcasts soon!

November 12, 2014

Preventing Future Rosetta “Tensions”

Filed under: Astroinformatics,Open Access,Open Data — Patrick Durusau @ 2:34 pm

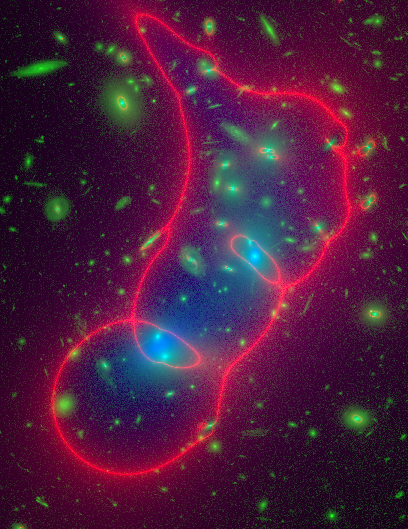
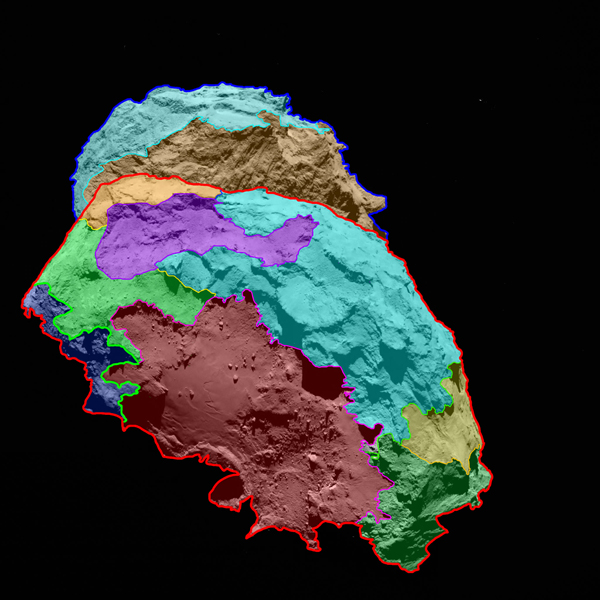
Tensions surround release of new Rosetta comet data by Eric Hand.

From the post:


For the Rosetta mission, there is an explicit tension between satisfying the public with new discoveries and allowing scientists first crack at publishing papers based on their own hard-won data. “There is a tightrope there,” says Taylor, who’s based at ESA’s European Space Research and Technology Centre (ESTEC) in Noordwijk, the Netherlands. But some ESA officials are worried that the principal investigators for the spacecraft’s 11 instruments are not releasing enough information. In particular, the camera team, led by principal investigator Holger Sierks, has come under special criticism for what some say is a stingy release policy. “It’s a family that’s fighting, and Holger is in the middle of it, because he holds the crown jewels,” says Mark McCaughrean, an ESA senior science adviser at ESTEC.

Allowing scientists to withhold data for some period is not uncommon in planetary science. At NASA, a 6-month period is typical for principal investigator–led spacecraft, such as the MESSENGER mission to Mercury, says James Green, the director of NASA’s planetary science division in Washington, D.C. However, Green says, NASA headquarters can insist that the principal investigator release data for key media events. For larger strategic, or “flagship,” missions, NASA has tried to release data even faster. The Mars rovers, such as Curiosity, have put out images almost as immediately as they are gathered.

Sierks, of the Max Planck Institute for Solar System Research in Göttingen, Germany, feels that the OSIRIS team has already been providing a fair amount of data to the public—about one image every week. Each image his team puts out is better than anything that has ever been seen before in comet research, he says. Furthermore, he says other researchers, unaffiliated with the Rosetta team, have submitted papers based on these released images, while his team has been consumed with the daily task of planning the mission. After working on OSIRIS since 1997, Sierks feels that his team should get the first shot at using the data.

“Let’s give us a chance of a half a year or so,” he says. He also feels that his team has been pressured to release more data than other instruments. “Of course there is more of a focus on our instrument,” which he calls “the eyes of the mission.”

What if there was another solution to the Rosetta “tensions” than 1) privilege researchers with six (6) months exclusive access to data or 2) release data as soon as gathered?

I am sure everyone can gather arguments for one or the other of those sides but either gathering or repeating them isn’t going to move the discussion forward.

What if there were an agreed upon registry for data sets (not a repository but registry) where researchers could register anticipated data and, when acquired, the date the data was deposited to a public repository and a list of researchers entitled to publish using that data?

The set of publications in most subject areas are rather small and if they agreed to not accept or review papers based upon registered data, for six (6) months or some other agreed upon period, that would enable researchers to release data as acquired and yet protect their opportunity for first use of the data for publication purposes.

This simple sketch leaves a host of details to explore and answer but registering data for publication delay could answer the concerns that surround publicly funded data in general.

Thoughts?

October 22, 2014

Web Apps in the Cloud: Even Astronomers Can Write Them!

Filed under: Astroinformatics,Social Media — Patrick Durusau @ 7:23 pm

Web Apps in the Cloud: Even Astronomers Can Write Them!

From the post:

Philip Cowperthwaite and Peter K. G. Williams work in time-domain astronomy at Harvard. Philip is a graduate student working on the detection of electromagnetic counterparts to gravitational wave events, and Peter studies magnetic activity in low-mass stars, brown dwarfs, and planets.

Astronomers that study GRBs are well-known for racing to follow up bursts immediately after they occur — thanks to services like the Gamma-ray Coordinates Network (GCN), you can receive an email with an event position less than 30 seconds after it hits a satellite like Swift. It’s pretty cool that we professionals can get real-time notification of stars exploding across the universe, but it also seems like a great opportunity to convey some of the excitement of cutting-edge science to the broader public. To that end, we decided to try to expand the reach of GCN alerts by bringing them on to social media. Join us for a surprisingly short and painless tale about the development of YOITSAGRB, a tiny piece of Python code on the Google App Engine that distributes GCN alerts through the social media app Yo.

If you’re not familiar with Yo, there’s not much to know. Yo was conceived as a minimalist social media experience: users can register a unique username and send each other a message consisting of “Yo,” and only “Yo.” You can think of it as being like Twitter, but instead of 140 characters, you have zero. (They’ve since added more features such as including links with your “Yo,” but we’re Yo purists so we’ll just be using the base functionality.) A nice consequence of this design is that the Yo API is incredibly straightforward, which is convenient for a “my first web app” kind of project.

While “Yo” has been expanded to include more content, the origin remains an illustration of the many meanings that can be signaled by the same term. In this case, the detection of a gamma-ray burst in the known universe.

Or “Yo” could mean it is time to start some other activity when received from a particular sender. Or even be a message composed entirely of “Yo’s” where different senders had some significance. Or “Yo’s” sent at particular times to compose a message. Or “Yo’s” sent to leave the impression that messages were being sent. 😉

So, does a “Yo” have any semantics separate and apart from that read into it by a “Yo” recipient?

FilterGraph

Filed under: Astroinformatics,Graphics,Visualization — Patrick Durusau @ 3:38 pm

FilterGraph

From the wiki:

Filtergraph allows you to create interactive portals from datasets that you import. As a web application, no downloads are necessary – it runs and updates in real time on your browser as you make changes within the portal. All that you need to start a portal is an email address and a dataset in a supported type. Creating an account is completely free, and Filtergraph supports a wide variety of data types. For a list of supported data types see “ Supported File Types ”. (emphasis in original)

Just in case you are curious about the file types:

Filtergraph will allow you to upload dataset files in the following formats:

ASCII text Tab, comma and space separated
Microsoft Excel *.xls, *.xlsx
SQLite *.sqlite
VOTable *.vot, *.xml
FITS *.fits
IPAC *.tbl
Numpy *.npy
HDF5 *.h5

You can upload files up to 50MB in size. Larger files can be accommodated if you contact us via a Feedback Form.

For best results:

  • Make sure each row has the same number of columns. If a row has an incorrect number of columns, it will be ignored.
  • Place a header in the first row to name each column. If a header cannot be found, the column names will be assigned as Column1, Column2, etc.
  • If you include a header, make the name of each column unique. Otherwise, the duplicate names will be modified.
  • For ASCII files, you may optionally use the ‘#’ symbol to designate a header.

Here is an example of an intereactive graph for earthquakes at FilterGraph:

graph of earthquakes

You can share the results of analysis and allow others to change the analysis of large data sets, without sending the data.

From the homepage:

Developed by astronomers at Vanderbilt University, Filtergraph is used by over 200 people in 28 countries to empower large-scale projects such as the KELT-North and KELT-South ground-based telescopes, the Kepler, Spitzer and TESS space telescopes, and a soil collection project in Bangladesh.

Enjoy!

September 20, 2014

219 million stars: a detailed catalogue of the visible Milky Way

Filed under: Astroinformatics — Patrick Durusau @ 7:22 pm

219 million stars: a detailed catalogue of the visible Milky Way

From the post:

A new catalogue of the visible part of the northern part of our home Galaxy, the Milky Way, includes no fewer than 219 million stars. Geert Barentsen of the University of Hertfordshire led a team who assembled the catalogue in a ten year programme using the Isaac Newton Telescope (INT) on La Palma in the Canary Islands. Their work appears today in the journal Monthly Notices of the Royal Astronomical Society.

The production of the catalogue, IPHAS DR2 (the second data release from the survey programme The INT Photometric H-alpha Survey of the Northern Galactic Plane, IPHAS), is an example of modern astronomy’s exploitation of ‘big data’. It contains information on 219 million detected objects, each of which is summarised in 99 different attributes.

The new work appears in Barentsen et al, “The second data release of the INT Photometric Hα Survey of the Northern Galactic Plane (IPHAS DR2)“, Monthly Notices of the Royal Astronomical Society, vol. 444, pp. 3230-3257, 2014, published by Oxford University Press. A preprint version is available on the arXiv server.

The catalogue is accessible in queryable form via the VizieR service at the Centre de Données astronomiques de Strasbourg. The processed IPHAS images it is derived from are also publically available.

At 219 million detected objects, each with 99 different attributes, that sounds like “big data” to me. 😉

Enjoy!

September 14, 2014

Astropy v0.4 Released

Filed under: Astroinformatics,Python — Patrick Durusau @ 3:58 pm

Astropy v0.4 Released by Erik Tollerud.

From the post:

This July, we performed the third major public release (v0.4) of the astropy package, a core Python package for Astronomy. Astropy is a community-driven package intended to contain much of the core functionality and common tools needed for performing astronomy and astrophysics with Python.

New and improved major functionality in this release includes:

  • A new astropy.vo.samp sub-package adapted from the previously standalone SAMPy package
  • A re-designed astropy.coordinates sub-package for celestial coordinates
  • A new ‘fitsheader’ command-line tool that can be used to quickly inspect FITS headers
  • A new HTML table reader/writer
  • Improved performance for Quantity objects
  • A re-designed configuration framework

Erik goes on to say that Astropy 1.0 should arrive by the end of the year!

Enjoy!

September 13, 2014

First map of Rosetta’s comet

Filed under: Astroinformatics,Mapping,Maps — Patrick Durusau @ 6:15 am

First map of Rosetta’s comet

From the webpage:

Scientists have found that the surface of comet 67P/Churyumov-Gerasimenko — the target of study for the European Space Agency’s Rosetta mission — can be divided into several regions, each characterized by different classes of features. High-resolution images of the comet reveal a unique, multifaceted world.

ESA’s Rosetta spacecraft arrived at its destination about a month ago and is currently accompanying the comet as it progresses on its route toward the inner solar system. Scientists have analyzed images of the comet’s surface taken by OSIRIS, Rosetta’s scientific imaging system, and defined several different regions, each of which has a distinctive physical appearance. This analysis provides the basis for a detailed scientific description of 67P’s surface. A map showing the comet’s various regions is available at: http://go.nasa.gov/1pU26L2

“Never before have we seen a cometary surface in such detail,” says OSIRIS Principal Investigator Holger Sierks from the Max Planck Institute for Solar System Science (MPS) in Germany. In some of the images, one pixel corresponds to a scale of 30 inches (75 centimeters) on the nucleus. “It is a historic moment — we have an unprecedented resolution to map a comet,” he says.

The comet has areas dominated by cliffs, depressions, craters, boulders and even parallel grooves. While some of these areas appear to be quiet, others seem to be shaped by the comet’s activity, in which grains emitted from below the surface fall back to the ground in the nearby area.

comet

The Rosetta mission:

Rosetta launched in 2004 and will arrive at comet 67P/Churyumov-Gerasimenko on 6 August. It will be the first mission in history to rendezvous with a comet, escort it as it orbits the Sun, and deploy a lander to its surface. Rosetta is an ESA mission with contributions from its member states and NASA. Rosetta’s Philae lander is provided by a consortium led by DLR, MPS, CNES and ASI.

Not to mention being your opportunity to watch semantic diversity develop from a known starting point.

Already the comet has two names: (1 67P/Churyumov-Gerasimenko and 2) Rosetta’s comet. Can you guess which one will be used in the popular press?

Surface features will be described in different languages, which have different terms for features and the processes that formed them. Not to mention that even within natural languages there can be diversity as well.

Semantic diversity is our natural state. Normalization is an abnormal state, perhaps that is why it is so elusive on a large scale.

August 22, 2014

Imaging Planets and Disks [Not in our Solar System]

Filed under: Astroinformatics,Image Processing — Patrick Durusau @ 5:53 pm

Videos From the 2014 Sagan Summer Workshop On-line

From the post:

The NASA Exoplanet Science Center (NEXScI) hosts the Sagan Workshops, annual themed conferences aimed at introducing the latest techniques in exoplanet astronomy to young researchers. The workshops emphasize interaction with data, and include hands-on sessions where participants use their laptops to follow step-by-step tutorials given by experts. This year’s conference topic was “Imaging Planets and Disks”. It covered topics such as

  • Properties of Imaged Planets
  • Integrating Imaging and RV Datasets
  • Thermal Evolution of Planets
  • The Challenges and Science of Protostellar And Debris Disks…

You can see the agenda and the presentations here, and the videos have been posted here. Some of the talks are also on youtube at https://www.youtube.com/channel/UCytsRiMvdj5VTZWfj6dBadQ

The presentations showcase the extraordinary richness of exoplanet research. If you are unfamiliar with NASA’s exoplanet program, Gary Lockwood provides an introduction (not available for embedding – visit the web page). My favorite talk, of many good ones, was Travis Barman speaking on the “Crown Jewels of Young Exoplanets.”

Looking to expand you data processing horizons? 😉

Enjoy!

July 29, 2014

HST V1.0 mosaics

Filed under: Astroinformatics — Patrick Durusau @ 6:46 pm

HST V1.0 mosaics released for Epoch 2 of Abell 2744

From the webpage:

We are pleased to announce the Version 1.0 release of Epoch 2 of Abell 2744, after the completion of all the ACS and WFC3/IR imaging on the main cluster and parallel field from our Frontier Fields program (13495, PI: J. Lotz), in addition to imaging from programs 11689 (PI: R. Dupke), 13386 (PI: S. Rodney), and 13389 (PI: B. Siana). These v1.0 mosaics have been fully recalibrated relative to the v0.5 mosaics that we have been releasing regularly throughout the course of this epoch during May, June and July 2014. For ACS, the v1.0 mosaics incorporate new bias and dark current reference files, along with CTE correction and bias destriping, and also include a set of mosaics that have been processed with the new selfcal approach to better account for the low-level dark current structure. The WFC3/IR v1.0 mosaics have improved masking for persistence and bad pixels, and in addition include a set of mosaics that have been corrected for time-variable sky emission that can occur during the orbit and can otherwise impact the up-the-ramp count-rate fitting if not properly corrected. Further details are provided in the readme file, which can be obtained along with all the mosaics at the following location:

From Wikipedia on Abell 2744:

Abell 2744, nicknamed Pandora’s Cluster, is a giant galaxy cluster resulting from the simultaneous pile-up of at least four separate, smaller galaxy clusters that took place over a span of 350 million years.[1] The galaxies in the cluster make up less than five percent of its mass.[1] The gas (around 20 percent) is so hot that it shines only in X-rays.[1] Dark matter makes up around 75 percent of the cluster’s mass.[1]

Admittedly the data is over 350 million years out of date but it is the latest data that is currently available. 😉

Enjoy!

July 12, 2014

Astropy Tutorials:…

Filed under: Astroinformatics,Python — Patrick Durusau @ 6:23 pm

Astropy Tutorials: Learn how to do common astro tasks with astropy and Python by Adrian Price-Whelan.

From the post:

Astropy is a community-developed Python package intended to provide much of the core functionality and common tools needed for astronomy and astrophysics research (c.f., IRAF, idlastro). In order to provide demonstrations of the package and subpackage features and how they interact, we are announcing Astropy tutorials. These tutorials are aimed to be accessible by folks with little-to-no python experience and we hope they will be useful exercises for those just getting started with programming, Python, and/or the Astropy package. (The tutorials complement the Astropy documentation, which provides more detailed and complete information about the contents of the package along with short examples of code usage.)

The Astropy tutorials work through software tasks common in astronomical data manipulation and analysis. For example, the “Read and plot catalog information from a text file” tutorial demonstrates using astropy.io.ascii for reading and writing ASCII data, astropy.coordinates and astropy.units for converting RA (as a sexagesimal angle) to decimal degrees, and then uses matplotlib for making a color-magnitude diagram an all-sky projection of the source positions.

The more data processing you do in any domain, the better your data processing skills overall.

If you already know Python, take this opportunity to learn some astronomy.

If you already like astronomy, take this opportunity to learn some Python and data processing.

Either way, you can’t lose!

Enjoy!

June 26, 2014

Asteroid Hunting!

Filed under: Astroinformatics,Crowd Sourcing — Patrick Durusau @ 6:29 pm

Planetary Resources Wants Public to Help Find Asteroids by Doug Messier.

From the post:

Planetary Resources, the asteroid mining company, and Zooniverse today launched Asteroid Zoo (www.asteroidzoo.org), empowering students, citizen scientists and space enthusiasts to aid in the search for previously undiscovered asteroids. The program allows the public to join the search for Near Earth Asteroids (NEAs) of interest to scientists, NASA and asteroid miners, while helping to train computers to better find them in the future.

Asteroid Zoo joins the Zooniverse’s family of more than 25 citizen science projects! It will enable participants to search terabytes of imaging data collected by Catalina Sky Survey (CSS) for undiscovered asteroids in a fun, game-like process from their personal computers or devices. The public’s findings will be used by scientists to develop advanced automated asteroid-searching technology for telescopes on Earth and in space, including Planetary Resources’ ARKYD.

“With Asteroid Zoo, we hope to extend the effort to discover asteroids beyond astronomers and harness the wisdom of crowds to provide a real benefit to Earth,” said Chris Lewicki, President and Chief Engineer, Planetary Resources, Inc. “Furthermore, we’re excited to introduce this program as a way to thank the thousands of people who supported Planetary Resources through Kickstarter. This is the first of many initiatives we’ll introduce as a result of the campaign.”

The post doesn’t say who names an asteroid that qualifies for an Extinction Event. 😉 If it is a committee, it may go forever nameless.

« Newer PostsOlder Posts »

Powered by WordPress